Discussion of Limitations of the Perturbation Technique for Measuring the Dielectric and Magnetic Properties of High Dielectric Constant Materials or Highly Conductive Materials
The perturbation technique is based on measuring the shift in frequency and the decrease in Q of resonant modes (in a cavity) caused by placing a small sample in a region of the cavity with relatively pure electric or magnetic field – depending on whether you wish to measure permittivity or permeability.
The theoretical expression that relates frequency and Q shift of a cavity resonance to values of the complex dielectric susceptibility, χe = χe´ - j χe″ , of a small sample in a region of pure electric field is :

-
where fE, QL,E are the cavity frequency and loaded Q, with the empty holder,
- Δf is the frequency shift produced by the sample,
- QL,S is the loaded cavity Q, with the holder and sample,
- Fsh is a real number dependent only on the sample shape,
- Vs and Vc are the sample and cavity volumes,
- A is a real calibration constant dependent only on the shape of the electric fields in the absence of the sample.
This expression is derived from basic electromagnetic theory under the assumption that the fields within the sample are essentially uniform – ie., that the microwave power absorption between the surface and the centre of the sample is small ! This assumption is only satisfied when the value of the Half-Power Depth ( see section 2) is larger than the diameter of the sample! If the data analysis produces values of the Half-Power Depth that are less than the sample diameter, the data analysis must be considered increasingly invalid, and the error becomes larger as the Half-Power Depth becomes smaller!
Note that in Equation 1, when the value of the complex susceptibility, χe = ε′-1 - j ε′′, becomes very large ( either the real or the imaginary part), Equation (1) tends to the limiting value :

Thus, for very large values of ε′ or ε′′, the frequency shift is very close to a maximum possible value determined by the two calibration constants, Fsh ( this is called the sample shape factor) and A, and by the volume of the sample. The calibration constants are determined using known samples of different shapes and known volumes and dielectric constants in the apparatus. The cavity volume is well known, and constant.
Thus, if there are frequency shift values that are larger than this limiting value, something is wrong – either the volume of the sample is larger than assumed, or the Shape Factor is smaller! The value of the Shape Factor has a relatively weak dependence on sample eccentricity, so usually the conclusion is that the sample volume must have been larger than assumed!
Substituting the limiting value of Δfmax into Equation (1), the value for χe′ that results from a measured value of Δf is given as

Note that when the difference between the measured frequency shift and the maximum possible shift is small, the value of χe′ will be very sensitive to slight changes in Δf , and thus to small errors in the measured peak frequency! The error in determining χe′ becomes very large when the frequency shift approaches the limiting value! The measurement errors of the MPN apparatus have been evaluated, and we have determined that, if the determined value of ε′ or ε′′ is larger than 150, all we can say is that the actual value is 150 or larger ! If a value gets even larger with successive measurements, one can say that it is increasing – but that is the most one can say!
Also note that when the measured frequency shift becomes larger than the limiting value, the “apparent” value of χe′ becomes negative – which is physically impossible ! When this occurs, the person doing the data analysis knows that something is wrong.
This is actually a common occurrence during our data analysis of dielectric measurements at high temperatures, when the real dielectric constant or the loss factor often increases because of thermally activated transformations or reactions with exponential dependence ( usually above 600ºC), and simultaneously, because of large thermal expansion coefficients or because of foaming or sample transformations, the sample is significantly larger than it was at room temperature. Thus for materials with large dielectric constant or loss factor, it is crucial to know the sample dimensions at each temperature during the high temperature measurement cycle.
Now to the problems with measuring magnetic susceptibility:
Note that the values of complex permeability in the microwave range for ferromagnetic and ferrimagnetic materials are usually in the ranges of μ' < 5 and μ'' < 1 .
For example, for unbiased magnetite powder ( density 2.84 g/cc) at 2450 MHz, the magnetic values are μ' ~ 1.5 and μ'' ~ 0.3 at 300ºC .
The problem with measuring magnetic susceptability for a material which has a large value of the dielectric constant is that, even when placing the sample in a region of the cavity having highest magnetic fields, there is still a small electric field in the region because of the sample size ( the electric field is zero only on a single line in space ). Even with only a few percent electric field, the frequency shift or Q shift produced by a value of ε' or ε'' ~ 50 is approaching that of the magnetic shift! The errors are thus very large, and require very accurate subtraction of the dielectric shifts – which requires very great reproducibility of samples and accuracy of calibration. Generally, this makes it essentially impossible to do useful magnetic measurements on any material with values of ε' or ε'' > 20 . Of course, if the value of the penetration depth determined in the dielectric properties measurement is less than the sample diameter, then the basic analysis formula will be increasingly approximate as well!
MPN Perturbation Measurement Error Estimates
The following is an attempt to estimate of the probable error of our perturbation measurements. First, it must be recognized that the relative dielectric constant is actually an absolute value! When multiplied by the value of the permittivity of free space, one obtains an absolute value, with units! One can measure the ratio of the dielectric constant of two materials much more accurately than one can measure the absolute value of the relative dielectric constant of a single material.
The MPN measurement system is of the relative dielectric permittivity measurement class, ASTM D2520-01, Method B or C. This requires the use of a known dielectric standard of the same shape and size as the unknown sample ( and preferably of approximately the same dielectric constant ). The frequency shift and Q change of the known and the unknown sample are compared using the perturbation formulas, and the unknown is determined.
This ASTM standard was withdrawn in 2010 , and has not been replaced!
We ( MPN) basically uses the technique of having multiple standard materials ( in practice 3 or 4 ) of different shape and sizes, and we use these to determine the calibration constants in the standard perturbation formula ( standard that is, as modified by MPN in a published paper(1) ) with sample shape factor corrections included ! Our assumed standard material values, at room temperature, are
(1) High Density Teflon ε' = 2.07 , ε'' < 0.001
(2) Single Crystal Sapphire, electric field along C-axis, ε' = 11.54 , ε'' < 0.0001
(3) OFHC Copper – conductivity so large that all internal fields are rejected. This is the equivalent of ε' > 1000 if the sample is in a region of pure rf electric field ( the internal sample fields approach zero for a large dielectric constant value) , or μ' = 0 if the sample is in a region of pure rf magnetic field ( magnetic susceptibility of -1 because all magnetic fields are rejected).
In doing our data analysis, we assume the values of our standards. We do not quote the error in these values – because we have no idea what the errors might be. This is a job for a standards lab to undertake ( NIST, possibly) When the values are determined more accurately, and errors assigned (and these will be absolute errors), then our the accuracy of data can be corrected accordingly, and uncertainty in our absolute values assigned.
The quotable errors in our measurements then, are errors relative to the values of our standards. We measure values of frequency shift and Q shift relative to the standards – and the experimental errors in doing this relative determination are what we quote!
The actual quantities measured by our apparatus are
1) the frequency of the peak (of the resonance) of the microwave power transmitted through the cavity ie., the peak in the “through” power ( for each peak).
2) the full width ( ie., the frequency width) at half-maximum power of these “through” power “peaks” .
The errors made in measuring these quantities can have several sources:
(a) the error with which the HP network analyzer determines the frequency of a peak and the Q of a peak ( depends on bandwidth and number of points over peak and inherent stability and calibrations of the network analyzer),
(b) errors caused by the variation in the position of the sample holder in the cavity, either azimuthal ( holders are not perfectly straight ), vertical or translational ( not in centre of hole)
(c) errors due to the position of the sample in the holder ( sample is 3.50 m diam, while holder ID is 4.0 mm , so sample can be in different positions, including on slight angle)
(d) errors due to contamination of the outside surface of the holder caused by handling
(e) errors due to the variation of the sample holder dielectric response with time ( moisture or contamination or distortion or re-crystallization…..many possibilities for high temperature runs!)
(f) effects due to slow cavity temperature change with time
(g) errors caused by rapid, time -dependent cavity response due to the thermal pulse in high temperature measurements.
The following discussion and examples are focused on the errors to be associated with our room temperature permittivity measurements of relatively low loss materials over our two different frequency ranges.
The prime errors of concern in room temperature measurements are (a) , (b) , (d) and (f) in the previous list.
Error (a): Experience has shown that a low “transmitted” signal level ( on the “thru” measurement) delivered to the network analyzer produces variation of the measured Q that appears to be random and statistical. The trouble is that, with our multimode cavities, the signal level changes dramatically between the lowest frequency mode ( loest signal level) and the highest frequency for fixed probes. There may be some clever way to overcome this – but we haven`t found it yet. If the coupling into and out of the cavity is set too high, the values measured for the Q are influenced strongly by the external circuit – which we cannot tolerate in our data analysis. Thus, we could adjust for stronger coupling and smaller error on the lowest frequency, but we would be less sure of the accuracy of our data analysis for the high frequency modesthta is, . This is something that could be quantified in the future.
With our present system, we aim for a coupling ( ie., a through power transmission, on resonance) of 10-3 - ie/. power out of cavity divided by power input to cavity.
MPN TM0n0 Multimode Cavity Error Discussion:
The present MPN standard TM0n0 multimode cavity has resonances at the following frequencies, and the graphical displays in the data analysis program follow the following conventions:
Legend for High Frequency Data Plots ( except for plots versus frequency) :
# Frequency(MHz) Symbol
1 397 red diamond, solid line (or may be omitted )
2 912 blue square, solid line
3 1429 black cross, solid line
4 1948 blue circle, dotted line
5 2466 red cross, dotted line
6 2986 black diamond, dotted line
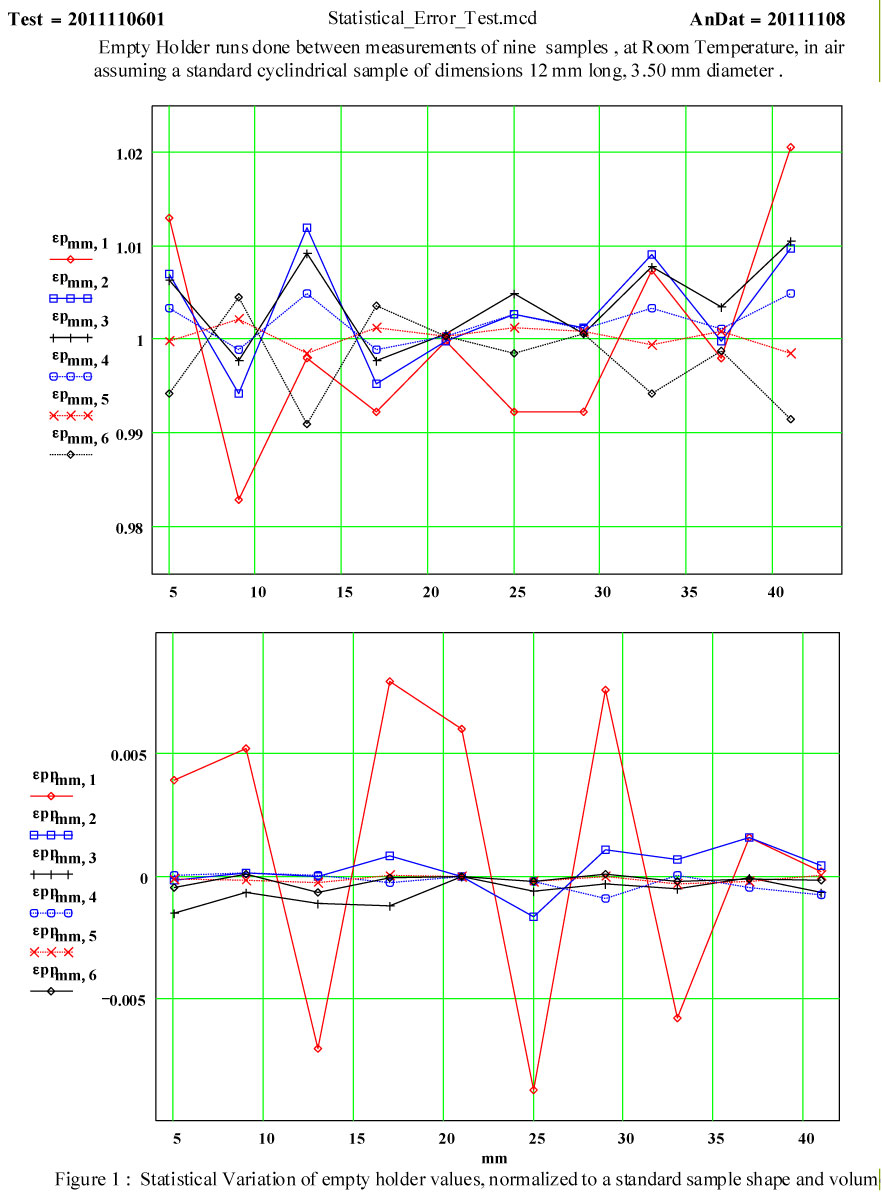
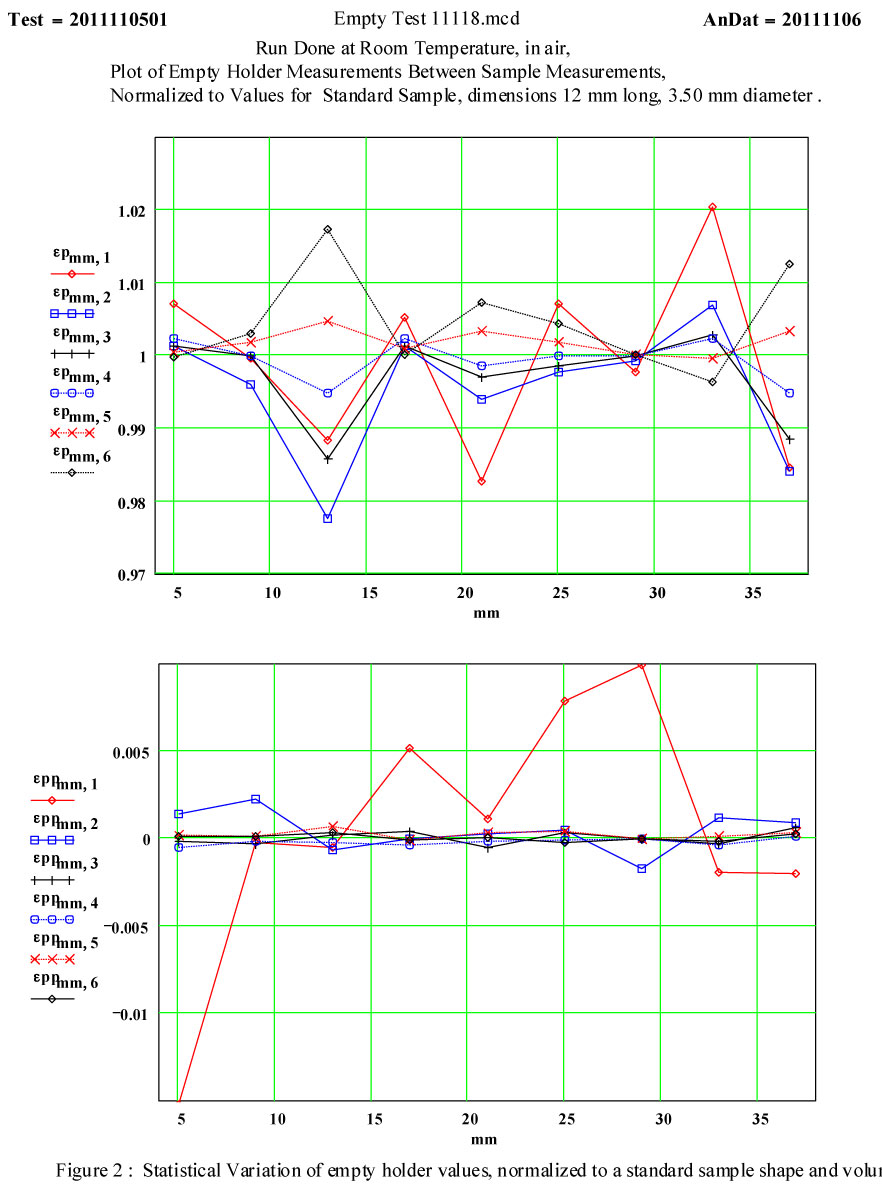
The following graphs ( Fig. 1 and Fig. 2 ) show the variation in the determined dielectric constant values for a standard size sample ( 3.50 m diam, 12 mm long), produced by the errors in the system which we attributable to sources (a) and (b). These were measured during a run in which different samples were being measured, one after the other, with empty holder measurements done before each new sample was introduced. This means that the sample holder was removed from the cavity and then re-introduced twice between each displayed empty holder run. Thus both errors (a) and (b) are included here, although we take special care to place the sample holder back into the cavity in the same azimuthal orientation.
We think the large random variation in the epp (that is, ε'') for the 400 MHz, lowest frequency, peak is attributable to low signal levels. The next lowest signal levels are for the second lowest frequency peak, the 912 MHz peak, and it has significantly more variation than the higher frequencies!
The same ranking of errors is seen in the values for ep (that is, ε'), although the relative effects on the determination of the peak frequency error are less. For the lowest frequency, an error of 100 Hz in the determination of the peak frequency produces an error Δε' ~ 0.02 .
These two graphs represent data collected under less than ideal conditions for room temperature measurements !
An even better technique for room temperature measurements would be to fix the sample holder ( one of the “flow through” type with a small hole in the base that holds the sample) firmly in place in the cavity, and then eject the sample between sample measurements with either dry argon or nitrogen pulses – or use a small wire inserted up the holder to lift each sample out. This would avoid any movement of the sample holder.
Another improvement would be to measure each sample multiple times to average the statistical variation caused by small signals in the lower two frequencies.
Another would be to match the sample dimensions more accurately to the dimensions of the calibration standards.
Another possible change would be to reduce the mismatch between the diameter of the sample and the standards compared to the ID of the holder – to limit sample position variation within the holder.
Another might be to explore using a lower dielectric constant material as a sample holder – Teflon, for example, because it has very low dielectric loss.
Exploration of all these options would likely reduce the relative errors between two different samples.
A reduction in the absolute error will depend upon a standards lab producing some new available dielectric standard materials!
Note that I have not mentioned one of the error corrections that we do regularly to try to eliminate - error (f) – those induced by slight changes in cavity temperature with time, which produce small, but quite noticeable, changes in cavity frequency. These obviously cannot be measured all the time, especially for high temperature measurements. To do this correction, we regularly measure the frequency of all the peaks with the sample holder up in the “ sample in furnace” position just before we drop the sample into position for a measurement. This is a frequency measurement with a clean, unchanging part of the sample holder actually in the “measurement” position – and is directly equal to the empty cavity frequency minus a fixed amount. This then can be used to calculate the continuing frequency shift of the cavity with time.
The following two graphs ( Fig. 3 ) show the changes in the determined values for the empty holder situation when the cavity frequency drift correction is turned off ! Clearly the cavity frequency varies with time, possibly due to small room temperature variation , orpossibly other reasons! We clearly need this correction!
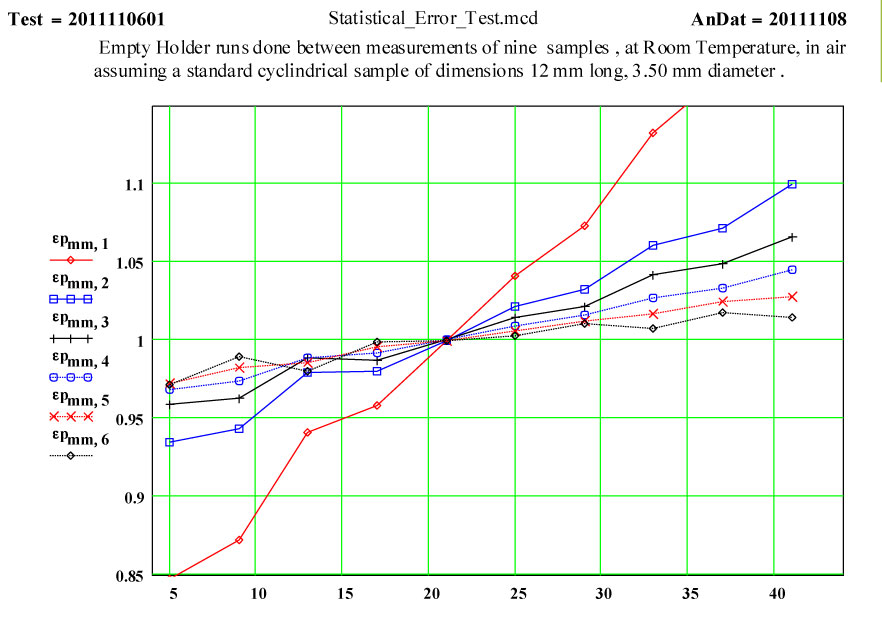
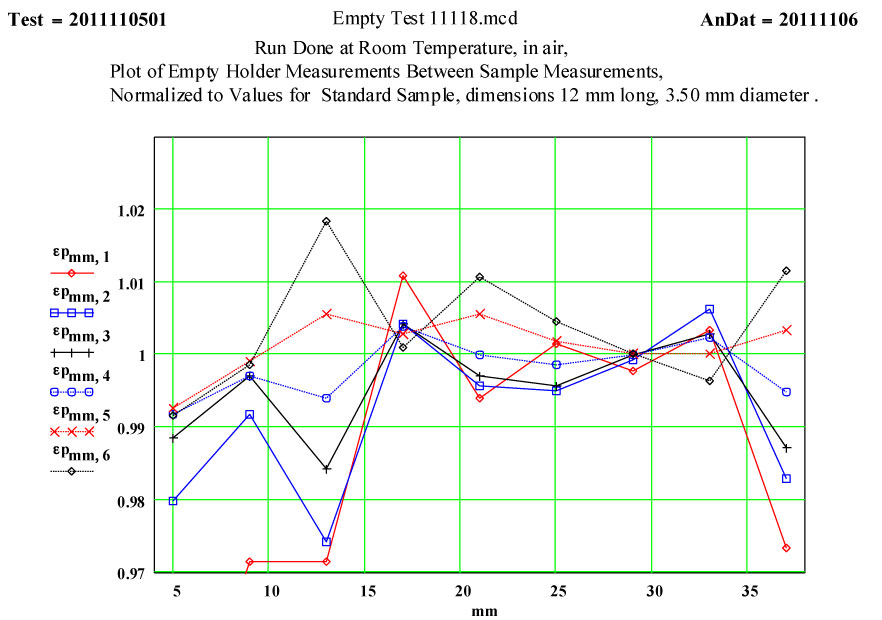
Fig. 3 Effect on Equivalent Dielectric Constant Values of Turning Off the TM0n0 Cavity Frequency-Shift Correction
MPN ¼ Wave Coax Multimode Cavity Error Discussion:
The present MPN ¼ wave TEM coax multimode cavity has resonances at the following frequencies, and the graphical displays in the data analysis program follow the following conventions:
Legend for Low Frequency Data Plots ( except for plots versus frequency) :
# Frequency(MHz) Symbol
1 54 red diamond, solid line
2 163 blue square, solid line
3 272 black cross, solid line
4 381 blue circle, dotted line
5 490 red cross, dotted line
6 599 black diamond, dotted line
The following graph ( Fig. 4 ) shows the variation in the determined dielectric constant values for a standard size sample ( 5.50 mm diam, 30 mm long), produced by the errors in the system which we attributable to sources (a) and (b). These were determined when measuring the “holder shank” values just before each sample measurement, using a run in which 9 different samples were being measured, one after the other, over a period of 50 minutes. This means that the sample holder was removed from the cavity and then re-introduced twice between each displayed “sample equivalent” holder shank value variation. Thus both errors (a) and (b) are included here, although we take special care to place the sample holder back into the cavity in the same azimuthal orientation.
Again, we think the large random variation in the epp ( ε'') for the 54 MHz, lowest frequency, peak is attributable to low signal levels. The next lowest signal levels are for the second lowest frequency peak, the 163 MHz peak, and it has significantly more variation than the higher frequencies! The fact that the errors are larger for this cavity than for the TM ono cavity is likely because Q is a factor of 2 ( or more) lower for the low frequency coaxial cavity.
The same ranking of errors is seen in the values for ep (ε'), although the relative effects on the determination of the peak frequency error are less. For the lowest frequency, an error of ~ 30 Hz in the determination of the peak frequency produces an error Δε' ~ 0.03.
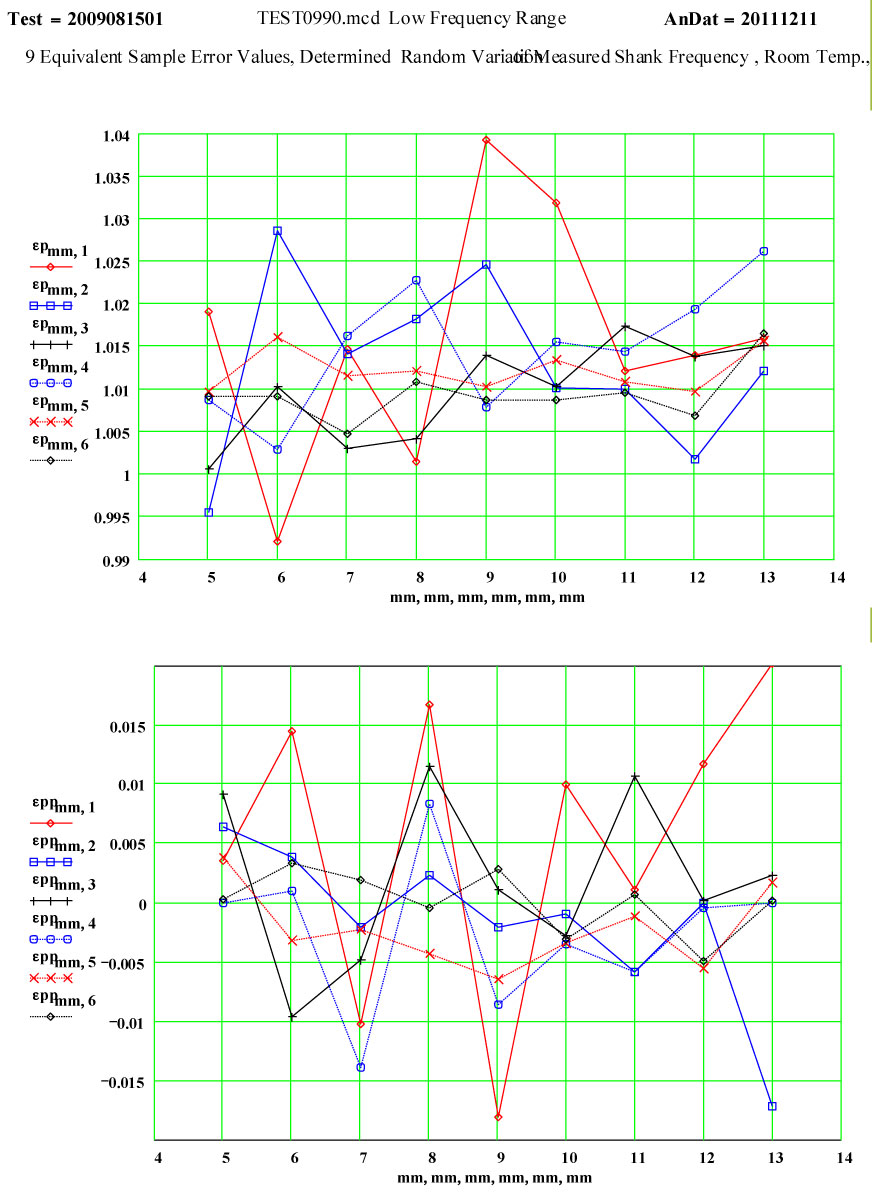
Fig. 4 : Equivalent Random Dielectric Constant Variation, 9 Sequential Measurements in the MPN ¼ Wave TEM Coaxial Multimode Cavity
Please feel free to phone or e-mail and discuss possible measurements. We treat all communications as confidential unless advised otherwise.
