The MPN measurement system can accommodate ceramic samples either in loose powder form, or as stacked pressed pellets or as a single solid piece (usually cut by diamond sawing or by diamond core-drilling). This allows the experimenter the option of choosing the physical state required, and, more importantly for practical applications, to do the measurements at the required density!
Kaolin Pellets
Zirconium Oxide
Silicon Carbide
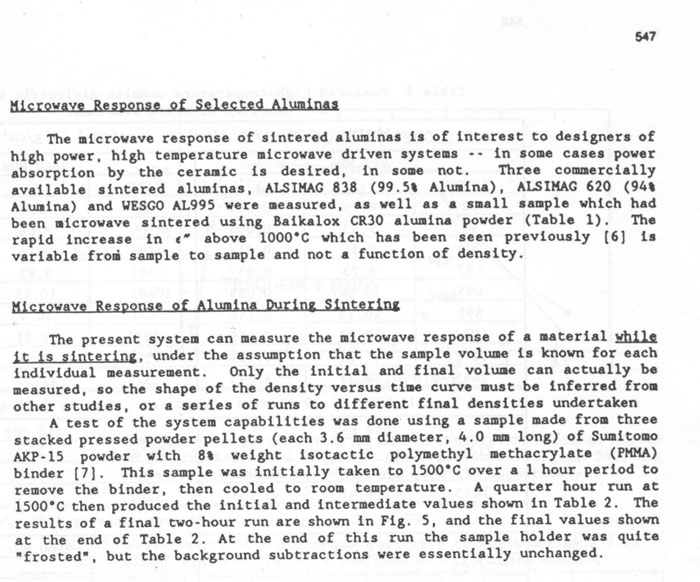
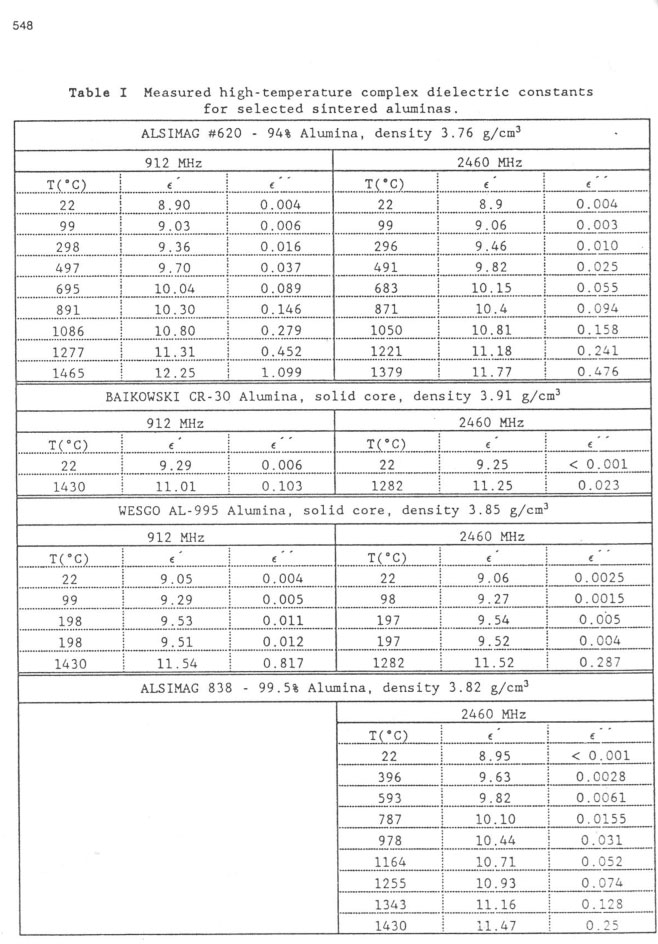
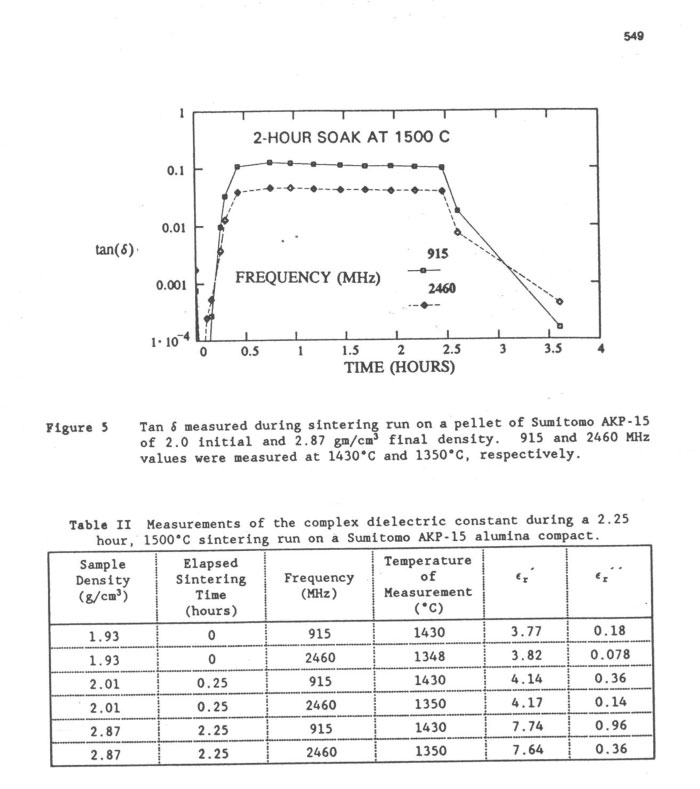
Selected Aluminas
Coorstek Ytteria Partially Stabilized Zirconia – YTZP, from 25ºC to 1150ºC
Sample Preparation, Description & Physical Properties:
The sample was diamond core-drilled from a piece of Coorstek YTZP (~ 3 wt% yttria, CoorsTek Stock #66901, circa 2004) and cut to length with a fine diamond saw. The Coors data sheet properties specified a density of 6.05 g/cc , and a CTE of 10.3 * 10 -6 /ºC up to 1000 ºC . After core-drilling, the sample was dried at 140 ºC for 2 hours in air.
Initial Sample Properties:
a) diameter 3.58 +- 0.03 mmb) length 12.05 +- 0.05 mm
c) mass 0.727 gm +- 0.002 gm
d) room temperature bulk density 5.99 ±0.15 gm/cc.
e) appearance - white rod
Final Sample Properties, at Room Temperature :
a) diameter 3.58 +- 0.03 mmb) length 12.05 +- 0.05 mm
c) mass 0.727 +- 0.002 gm
d) room temperature density 5.99 ±0.15 gm/cc.
e) appearance - white rod
Measurement Run Conditions:
The sample was mounted in a ‘flow-through’ 4 mm ID silica holder ( an ~ 1.5 mm diameter hole in base), and an airflow of ~8 sccm ( standard cubic centimetres per minute) of ‘Zero Air’ was sent upwards past the sample.
Two dielectric properties measurements were performed at each temperature at RT, then 50ºC, then in 50°C steps up to 600ºC, after which single measurements were done at each temperature up to 1150°C, then in -100ºC steps down to 200ºC, then RT. Immediately after the run finished, the sample was removed from the holder, the holder was re-inserted into the apparatus, and empty holder measurements were made in 200ºC steps up to 1100ºC, to check for holder contamination. There was none.
Data Analysis - Conditions & Assumptions:
An initial data analysis was done using our cavity perturbation theory, assuming a thermal expansion coefficient of ~ 10 * 10-6/ºC. (Coors lists a thermal expansion coefficient value of 10.3 * 10-6/ºC up to 1000ºC.) This analysis produced negative values for ε′ above 1000ºC, which is clearly un-physical, and indicates something is wrong in the data analysis.
The ε′ and ε′′ values presented here were obtained using a two-component thermal expansion coefficient in the data analysis code, clearly suggesting a larger value of the CTE above 900ºC !

Plot of the assumed values of the linear thermal expansion coefficient for YTZP .
&nnbsp;
Legend for Data Plots :
| # | Frequency(MHz) | Symbol |
|---|---|---|
| 1 | 397 | red diamond, solid line |
| 2 | 912 | blue square, solid line |
| 3 | 1429 | black cross, solid line |
| 4 | 1948 | blue circle, dotted line |
| 5 | 2466 | red cross, dotted line |
| 6 | 2986 | black diamond, dotted line |
Discussion of Results:
The values of e¢ and ε′′ above 700ºC are strongly dependent on the assumed value of the thermal expansion coefficient. This is not a very satisfactory situation, and detailed CTE data up to 1200ºC are required.
Another basic problem is that our data analysis relies on there being a relatively uniform electric field distribution within the sample. This is one of the reasons we choose a small diameter for our sample. When the field in the interior of our sample is lower than on the outer part of the sample, our data analysis equations are basically not valid! Thus, when our data analysis indicates that the Half-Power Depth is smaller than the sample diameter, as occurs for this sample above 900ºC, our determined values for higher temperatures become increasingly inaccurate!
Plots of Measured Values :


MPN Measurement of Complex Dielectric Constant of Kaolin Pellets at Microwave Processing Frequencies
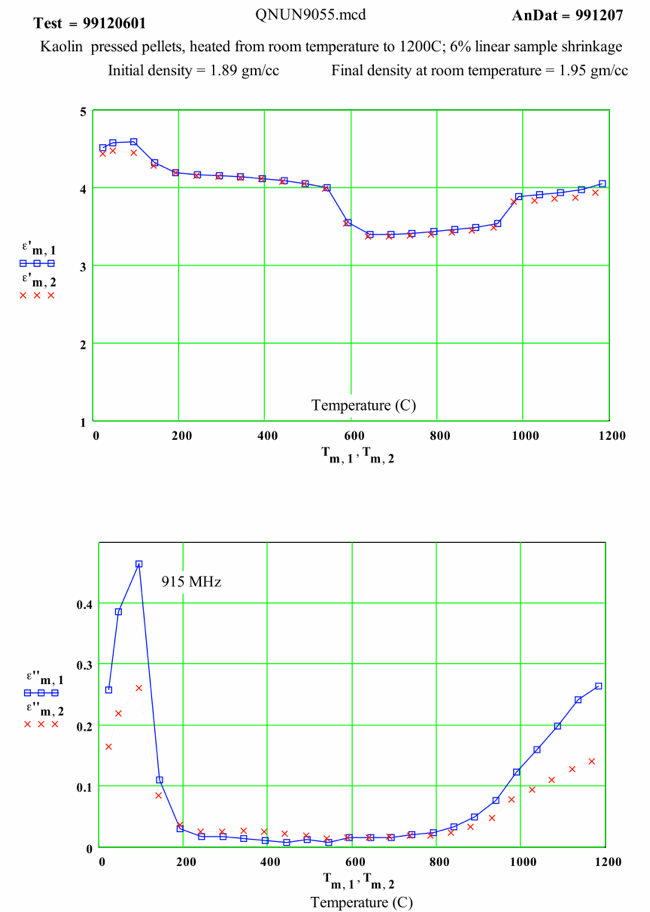
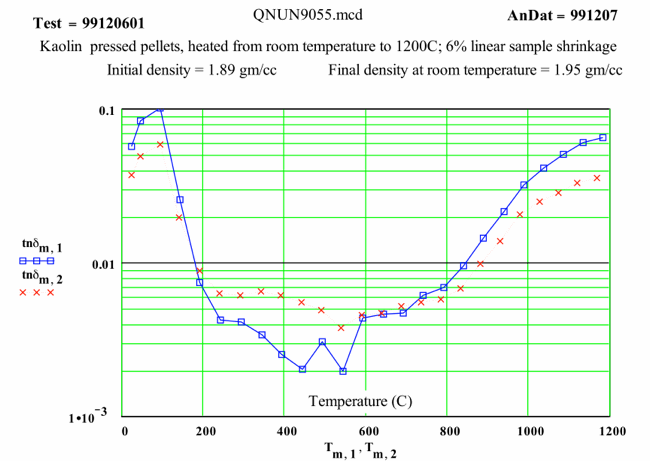
The values of ε' and ε" were measured for a pressed pellet of kaolin powder, at 915 and 2460 MHz, in air. The temperature was ramped from room temperature to 1200ºC over 4 hours. The final sample mass was 86% of the initial mass, the result of the evolution of water of crystallization at ~ 600ºC. The increase in the values of ε' above 1000ºC is the result of the collapse at 980ºC of the highly defected initial crystal structure into crystalline mullite and silica ( 6% measured linear shrinkage ). (See Kingery,Bowen,Uhlman; "Introduction to Ceramics", pg. 319 and 420)
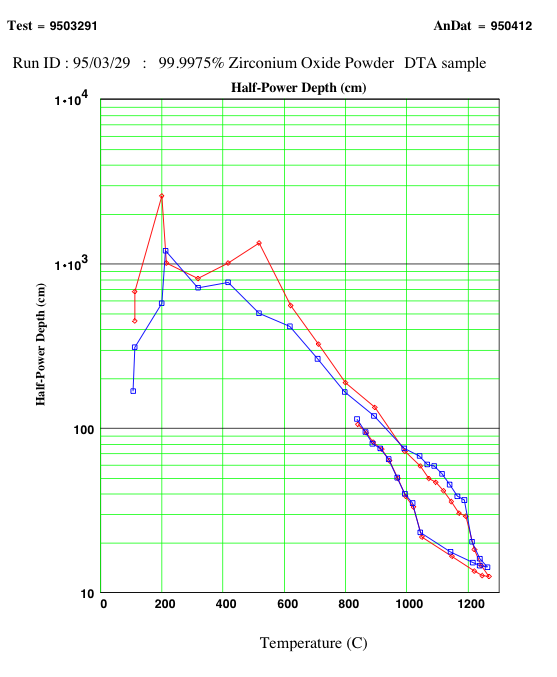
Dielectric Properties of Pressed Pellets of High Purity ( 99.9975%) Zirconium Oxide Powder from Johnson & Matthey
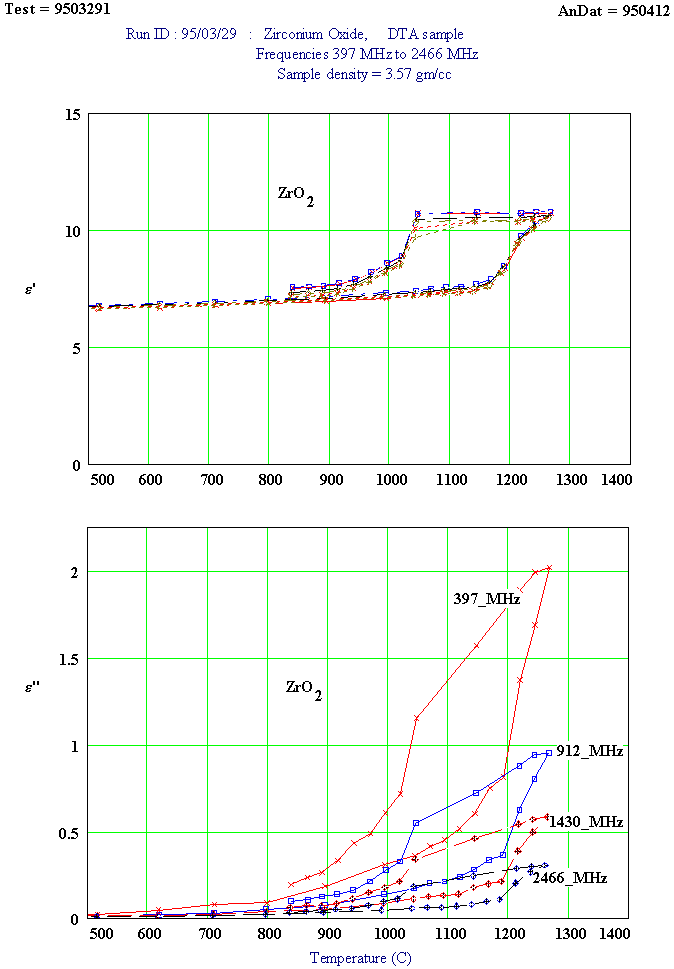
Three pressed pellets were stacked to form the test sample. The temperature was taken in steps up to 1275ºC, and then back to down to ~ 850ºC, with measurements taken at each frequency at each temperature step. Note the hysteresis associated with the well-known monoclinic ( low temperature) to tetragonal ( high temperature) transition at ~ 1100ºC, which has an associated 9% volume contraction when going from low to high temperature!
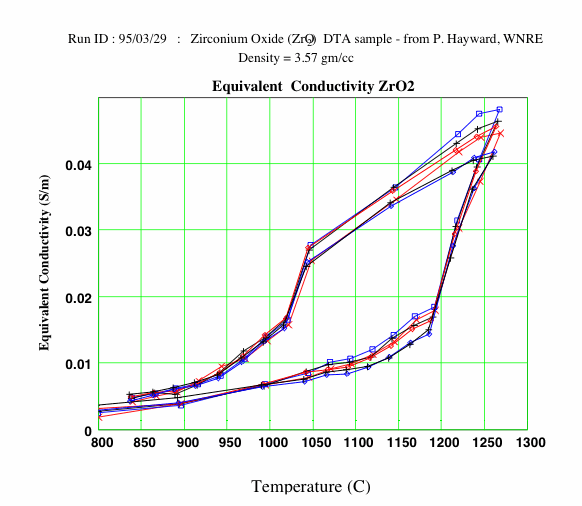
The "equivalent conductivity" is obtained by multiplying the ε" value by the frequency and by the permittivity of free space ( see theory section). If the loss mechanism is conduction electrons, then the equivalent conductivity values should be independent of frequency, since electron conductivity is effectively independent of frequency. This seems to be the case here for Zirconium Dioxide.
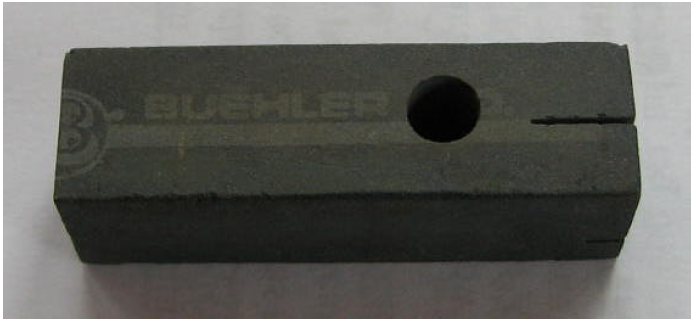
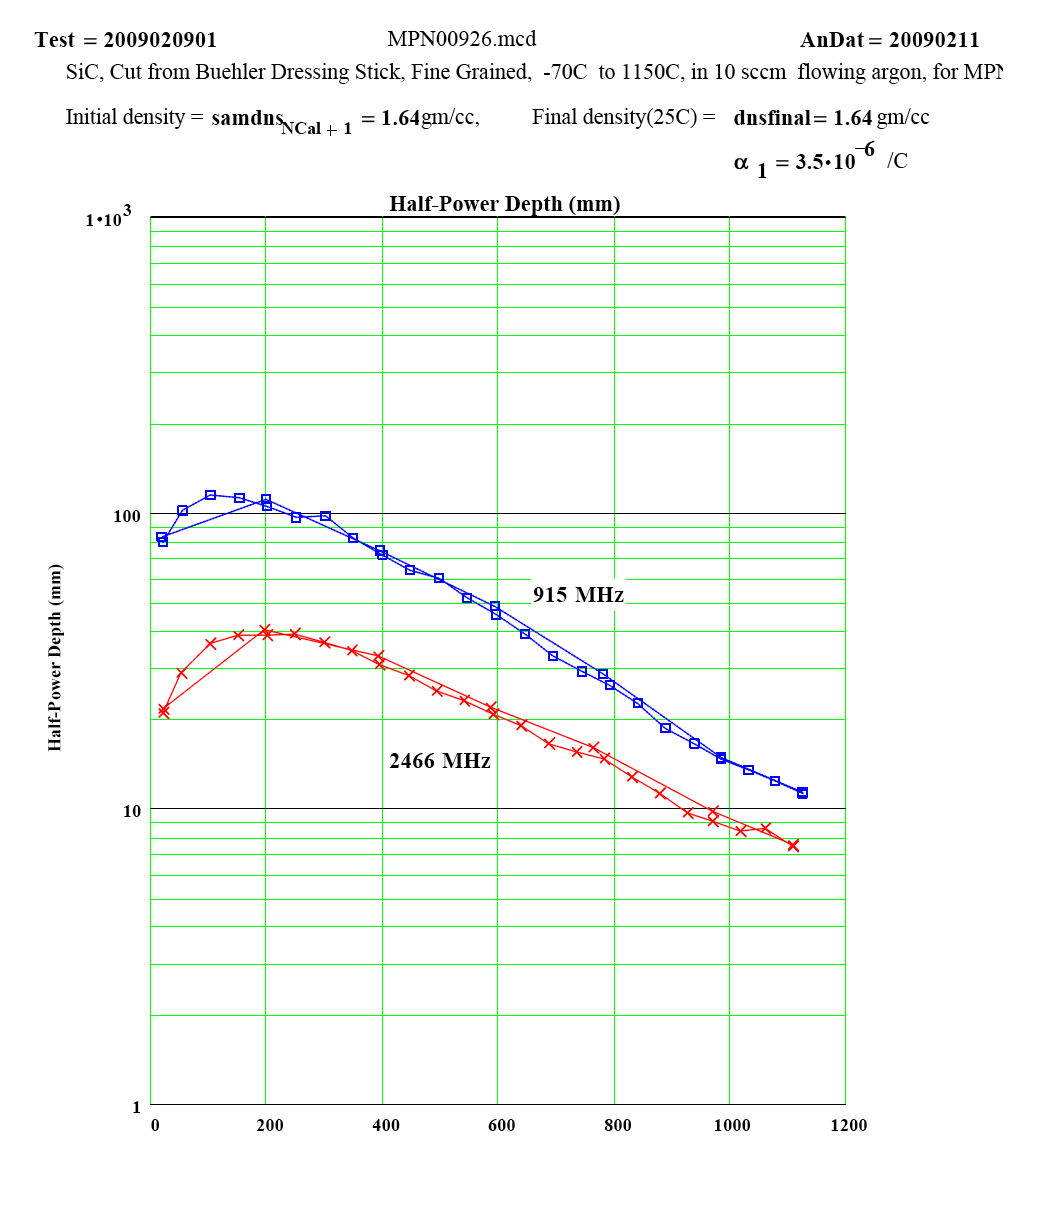
Silicon Carbide – fined grained commercial "dressing stick"
Sample description:
The sample was a solid cylinder, diamond core-drilled out of a commercial "Buehler"
silicon carbide "dressing stick" ( ~ 13 mm X 13 mm square, > 40 mm long) of circa 1996
vintage. The actual composition of the material is not known.
- length 11.16 mm
- diameter 3.28 mm
- mass 0.155 gm
- bulk density 1.64 g/cc
- DC resistivity > 104 ohm-meter
Measurement Cycle Parameters:
The measurements shown here were done in two “runs”. The first used a standard
furnace to cycle the sample to 1150°C, with measurements at 50°C steps, done in
flowing ( 10 sccm) UHP argon. The second “run” used a sample cryostat cooled to –70C,
which was allowed to slowly warm up to room temperature, with measurements in air
during the warming period.
Comments on the Data:
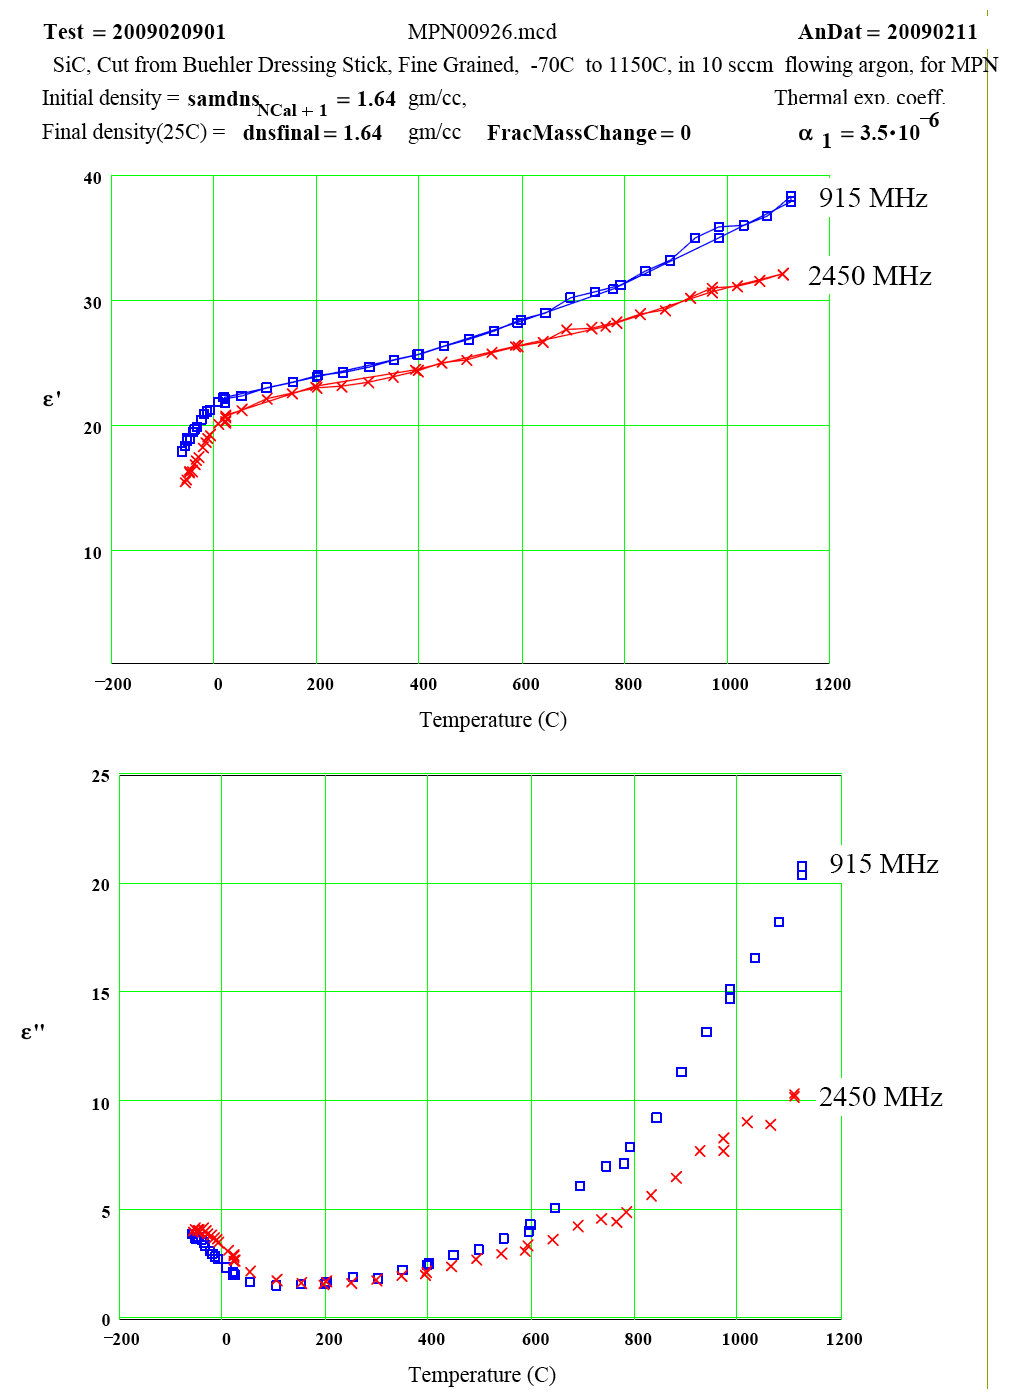
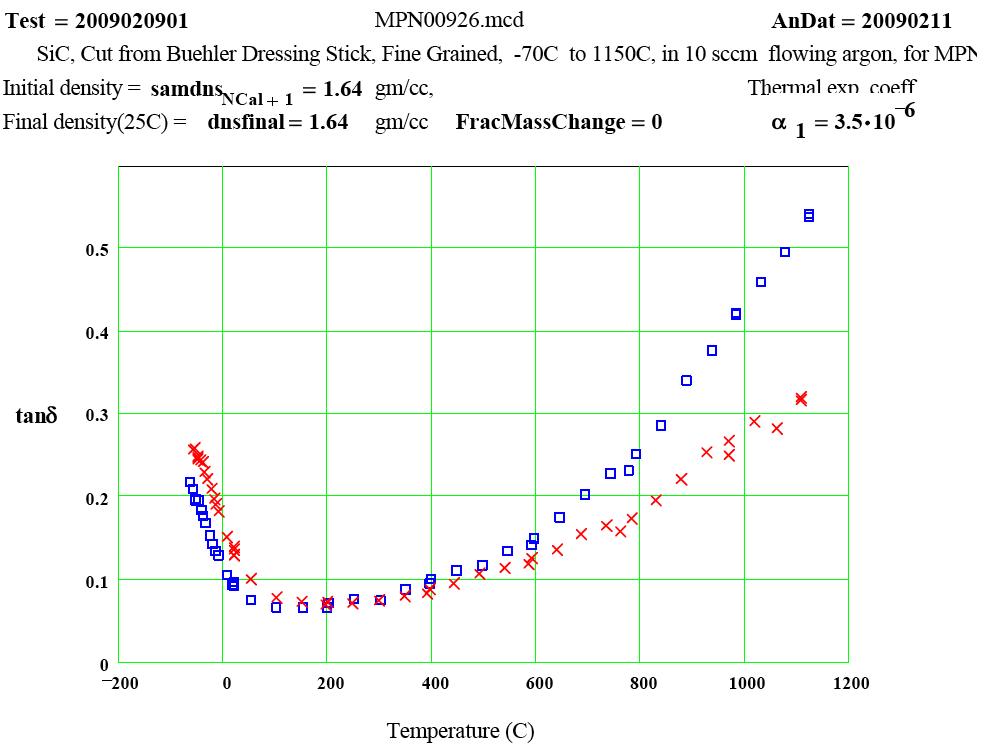
The room temperature value of the DC resistivity implies values of ε" < 0.01 , if the
only dielectric loss mechanism were conduction electron resistivity. Since the measured
values of ε'' are two orders of magnitude greater, the dielectric loss mechanism is
something quite different!
The high temperature loss mechanism has an activation energy of ~ 36 KJ/mol or in
conduction electron loss formalism, a band gap of ~ 0.75 eV
Clearly a strong temperature dependent mechanism is causing a peak in the loss
behaviour at < -80°C.
| Plot Legend: | blue squares | 915 MHz |
| Red crosses | 2450 MHz |
MPN_Selected_Aluminas_(MRS Proc. Vol. 269, 1992 ) Oct. 6 / 2010
Please phone or e-mail to discuss possible measurement configurations.
We treat all communications as confidential unless advised otherwise.
Dr. Ron Hutcheon, Ph. 613 584 1029
hutcheon@magma.ca
