Goethite
Olivine
Talc
Epsom Salts
MADOC Marble
Aragonite
Hematite-4% Hydrogen
The MPN measurement system can accommodate ceramic samples either in loose powder form, or as stacked pressed pellets or as a single solid piece (usually cut by diamond sawing or by diamond core-drilling). This allows the experimenter the option of choosing the physical state required, and, more importantly for practical applications, to do the measurements at the required density!
Measured Dielectric Properties of Goethite (FeOOH) up to 650° C
These goethite measurements were done using pressed powder pellets of initial density 3.08 g/cc. The heating rate during the measurements was 3.2°C/min. After the cycle to 650°C, the pellet density at room temperature was 2.75 g/cc. The peak at ~ 380°C is a de-watering transition, forming defected Fe2 O3 .

Comparison of Derivative of DTA Signal with Temperature Dependent Dielectric Properties Measurements
2αFeOOH = αFe2O3 + H2O

Olivine


Talc: Magnesium Silicate Hydroxide ( Mg3 Si4 O10 (OH)2 )
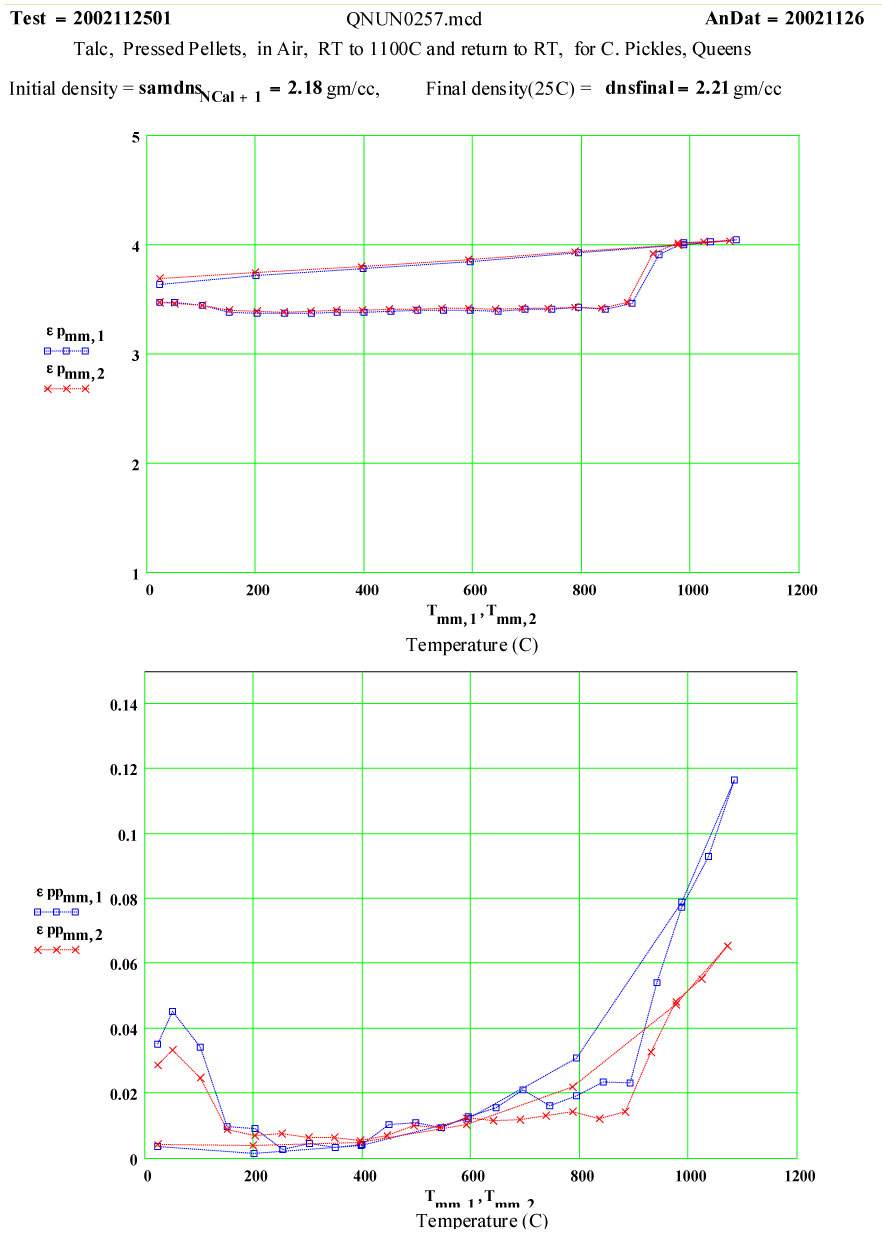
Intent of Measurement:Talc is known to “de-water” when heated. Dana`s Minerology states that “half the water is lost below a dull red heat, the remainder rapidly at ca 900ºC ” . The predicted weight loss is 4.75%. This experiment was designed to measure the complex dielectric constant during a cycle to 1100ºC while de-watering was occurring. This was a collaborative measurement with Dr. Chris Pickles of Queen`s University, Kingston. Ontario.
Sample Description:
The sample was made by uniaxially pressing fine white talc powder into pellets, which were stacked to form the measurement sample. The theoretical density of talc crystals is quoted as 2.58 to 2.83 g/cc. Thus the pressed pellets used were at ~ 80% crystalline density.
Initial Sample Properties:
- length (height) 13.57 ± 0.05 mm
- diameter 3.65 ± 0.05mm
- mass 0.310 ± 0.002 gm
- bulk density of pellets 2.18 g/cc
- appearance 4 white pellets
Measurement Cycle Parameters:
The measurements were done in a single “run” cycle, with the furnace being stepped in 50ºC increments to each temperature up to 1100ºC and then held there for a short soak period before each measurement was done. The return down to room temperature was done in -200C increments.
Final Sample Properties:
- length 13.27 ± 0.05 mm
- diameter 3.57 ± 0.05mm
- mass 0.294 ± 0.002 gm
- bulk density in holder 2.21 g/cc
- appearance 4 white pellets
Comments on the Data:
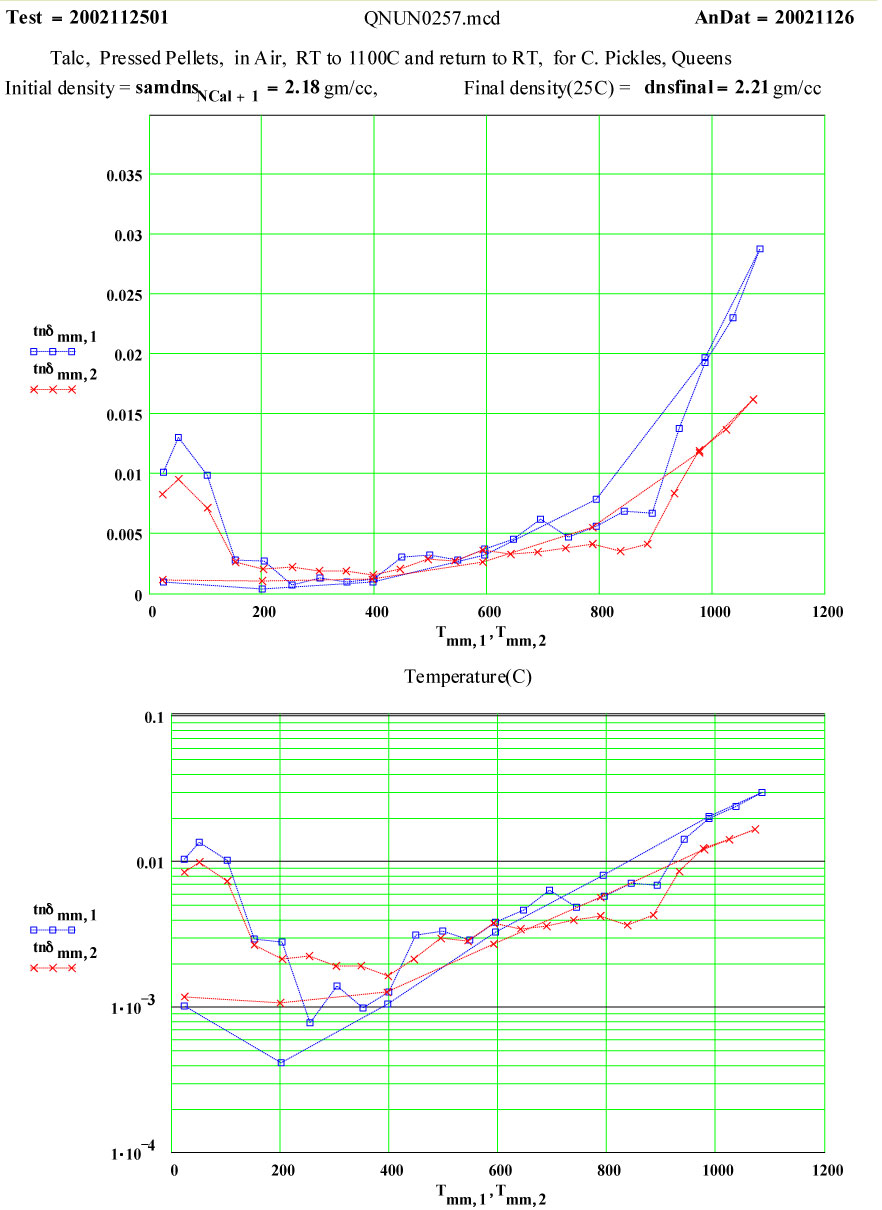
The small peak in ε″ values just above room temperature which disappears by 150ºC may be attributable to surface adsorbed moisture, but the magnitude suggests < 0.3wt% water. Thus this peak does not represent a significant amount of de-watering. Any “water” released above this temperature would be in the form of steam, which has very low density and very low microwave absorption.
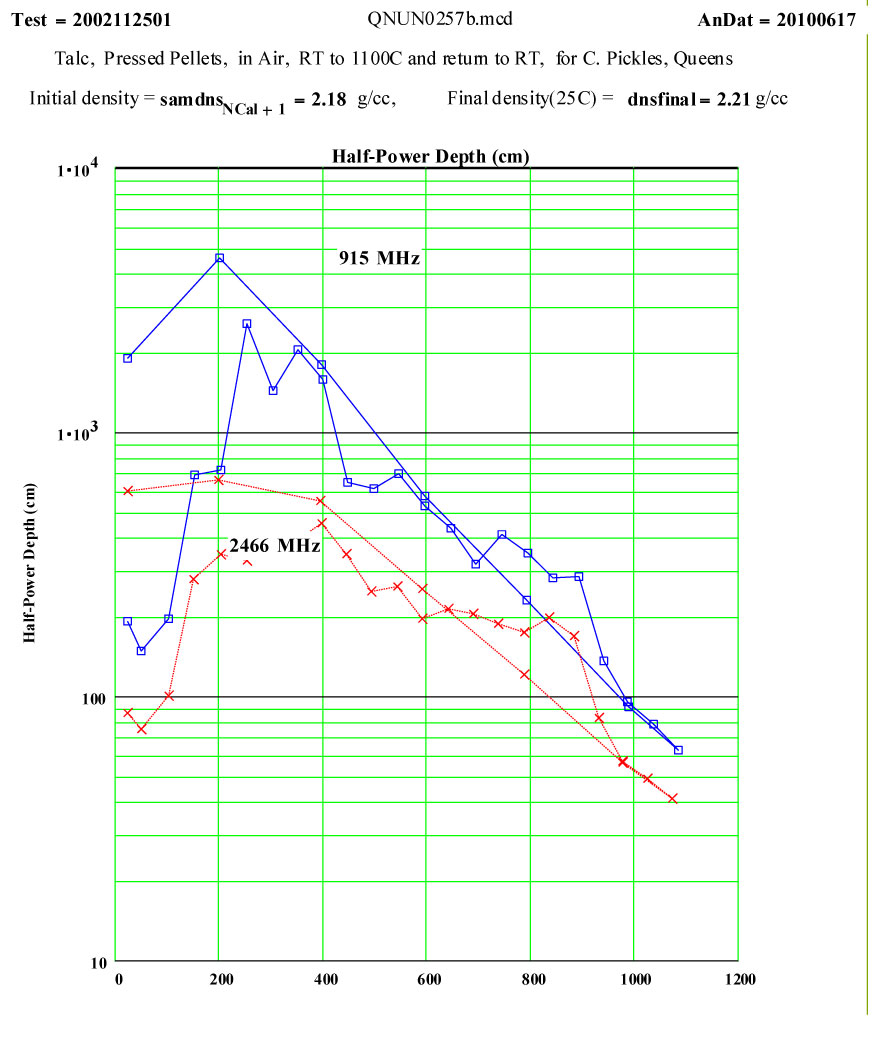
Between 900 and 950ºC an absorption mechanism switches on ( presumably the structure de-watering transformation, involving mobile protons and OH radicals?) , and by 975ºC this is finished, leaving behind a presumably defected material which has higher microwave absorption than the original talc, even though the “water” has been removed!
From 1000ºC on, a slight amount of sintering occurs, with thermally activated “intrinsic absorption”. The frequency ratio suggests this is largely thermally activated free electron conductivity ( ie., intrinsic semiconductor-like loss mechanism, again with ~ 1.3 eV band gap).
The measured weight loss was ~ 5.2 ±1.3 %, and the final RT density is 1.3 % higher ( a modest amount of sintering?).
The frequency coding on the plots is :
Legend for Data Plots :
# Frequency(MHz) Symbol
1 912 blue square, solid line
2 2466 red cross, dotted line
Epsom Salts - Magnesium Sulphate Heptahydrate ( MgSO4·7H2O )
Intent of Measurement:
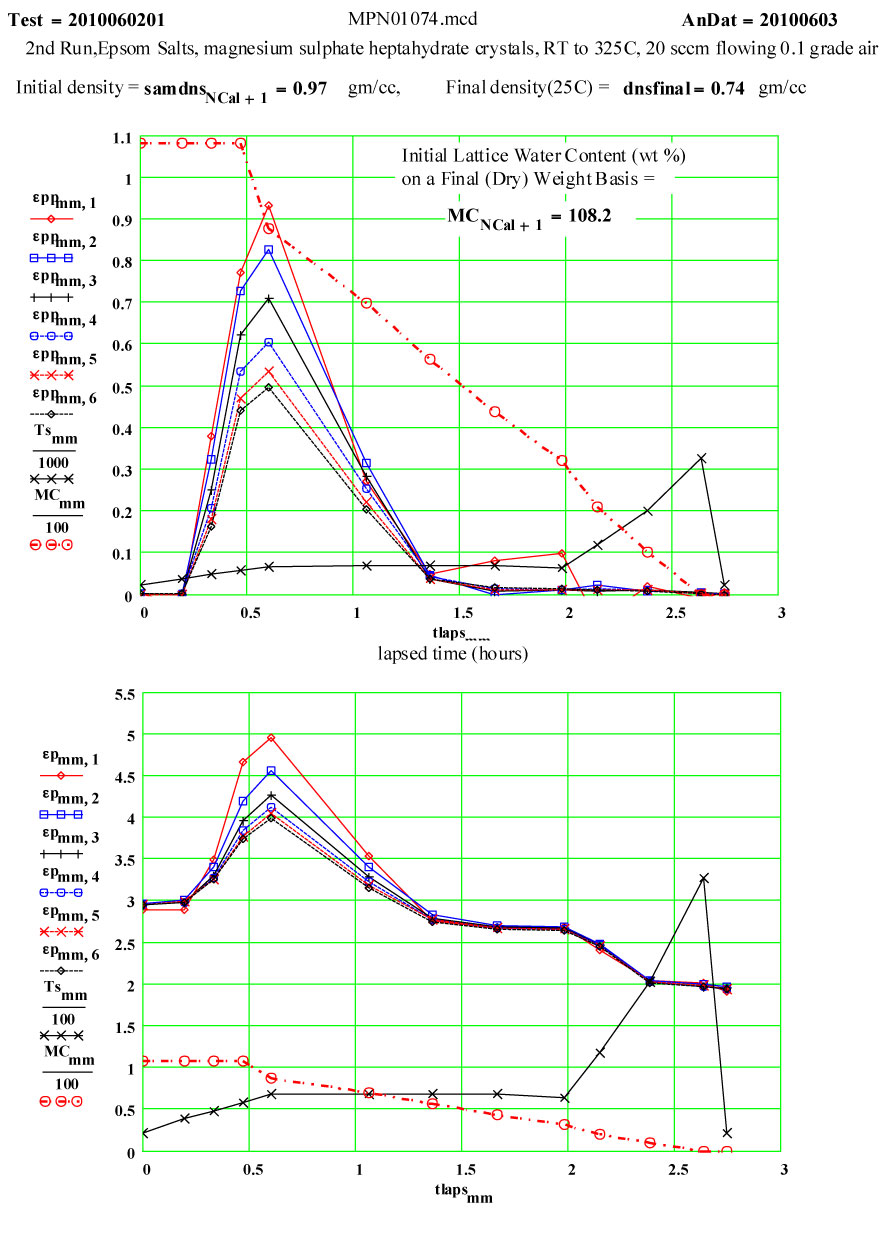
Epsom Salts are known to “de-water” slowly at room temperature, and much more rapidly as they are heated. This experiment was designed to measure the complex dielectric constant first at room temperature, and then while the material was being heated and de-watering was occurring. The values of ε′′ are a measure of the relative absorption of microwaves during this process.
Sample Description:
The sample was a coarse white powder ( chips and small clear crystals – typical Epsom salts) USP grade, purchased in an ordinary drug store. The MERCK Index (#5573) gives the single-crystal density of magnesium sulphate heptahydrate as 1.67 g/cc. The heating of Epsom salts is expected to release water from the crystal structure, and the MERCK Index says the final water molecule is released at ~ 250ºC, leaving behind pure magnesium sulphate. The progression of the water loss as a function of temperature, as given in thr MERCK Index was used here for intermediate mass determinations. The expected ratio of the final mass to the initial mass is 0.488. This means that almost half of the initial mass is in the ·7H2O component, and that the density of “water” in Epsom Salts is ~ 85% that of liquid water!Six of these “waters” have the constituent atoms located at coordinated lattice sites, the seventh is identifiable as a water molecule located at specific lattice sites (Axis, Volume 1, #9 (2005) pg. 12 (www.MineralogicalRecord.com) .
The sample preparation consisted simply of opening the sealed container immediately before use, and pouring powder into our silica sample holder to the appropriate height, and tamping lightly.
Initial Sample Properties:
- length (height) 12.13 mm
- diameter 4.03 mm
- mass 0.148 gm
- bulk density in holder 0.97 g/cc
- appearance white chips and powder
Measurement Cycle Parameters:
The two measurement runs shown here were each done in aa automated sequence, with the furnace being stepped to each temperature and then held there for a short soak period before each measurement was done. Because water would be evolved during the cycle, dry air was forced up through the powder continuously during the run so that moisture would be swept up and out of the sensitive measurement volume ( the air flow-rate was increased 20 sccm during the 2nd run – standard cubic centimeters per minute) . The crystallites should not have had more than a very thin layer of moisture at temperatures below 100ºC.
Final Sample Properties:
- length 7.80 mm
- diameter 4.03 mm
- mass 0.073 gm
- bulk density in holder 0.74 g/cc
- appearance ivory white chips and powder
Comments on the Data:
On warm-up, the values of ε′ at room temperature and ~ 38ºC are almost the same, and the loss factor values are both low, ε′′ < 0.01 . This is what would be expected of a crystalline structure where the atoms are well bonded onto lattice sites. At higher temperatures, the response of the material increases dramatically, with an increase of a factor of 200 in the values of ε′′ , but returning to very low values at and above 200ºC.
If the dielectric loss mechanism were free liquid water molecules, one would expect much higher values of ε′ ( > 30 ) , since the density of “water” in the sample is ~ 85% of that of free water! Also, measured values of ε′′ are larger at high frequency, which is opposite to known free water values.
Measurements on other de-hydrating minerals (see MPN Goethite data at www.microwavepropertiesnorth.ca ) suggests that the basis of the loss mechanism is ions migrating interstitially in the crystal lattice (protons, oxygen(2-) and possible hydroxyl radicals). When they emerge at a crystallite boundary, they re-combine to form true water molecules, and then are swept away by the flowing air – so that free water does not accumulate in the sample. To substantiate this, a second run was done, in which the temperature was held for ~ 1.4 hours at 69ºC. The data clearly demonstrate the lack of accumulated water in the sample, and that the dry air flow in the sample is sufficient to sweep out the free water molecules.
Plot Legend:
# Frequency(MHz) Symbol
1 397 red diamond, solid line2 912 blue square, solid line
3 1429 black cross, solid line
4 1948 blue circle, dotted line
5 2466 red cross, dotted line
6 2986 black diamond, dotted line
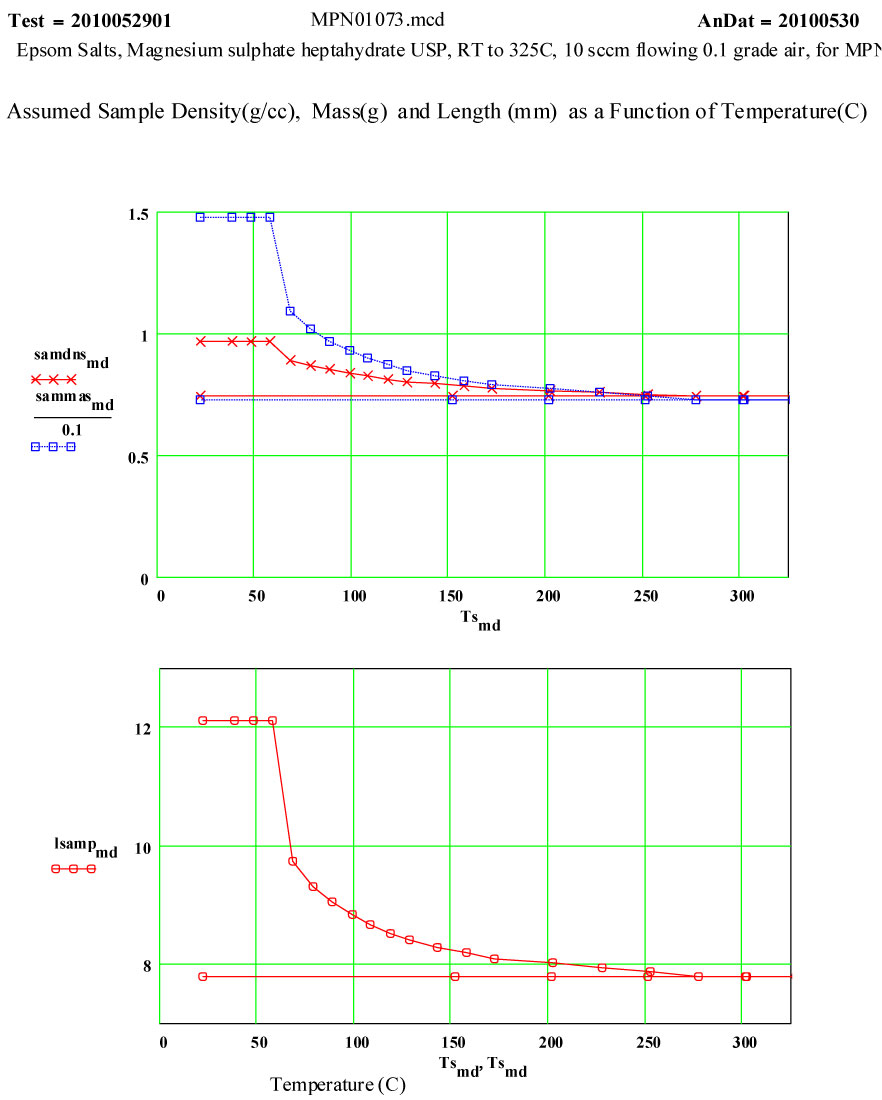
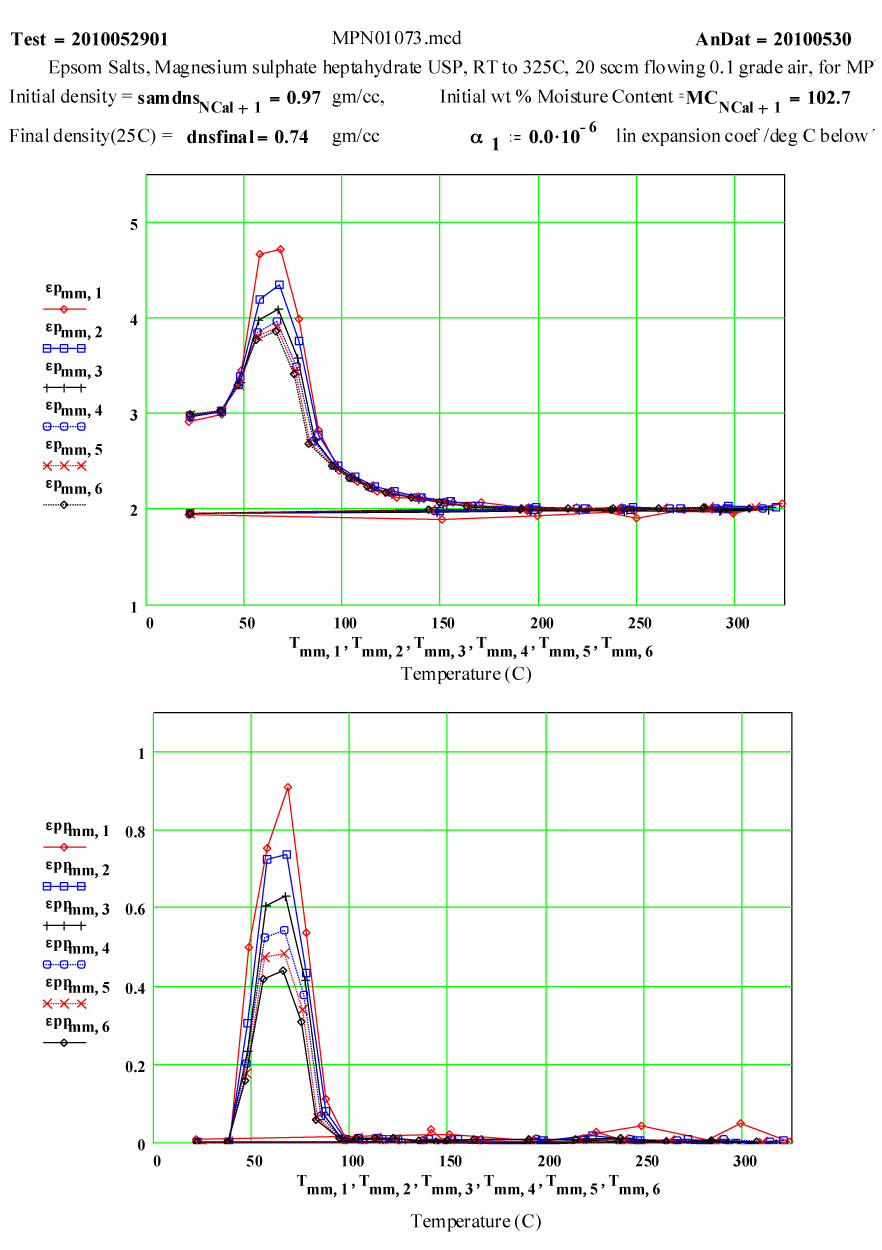
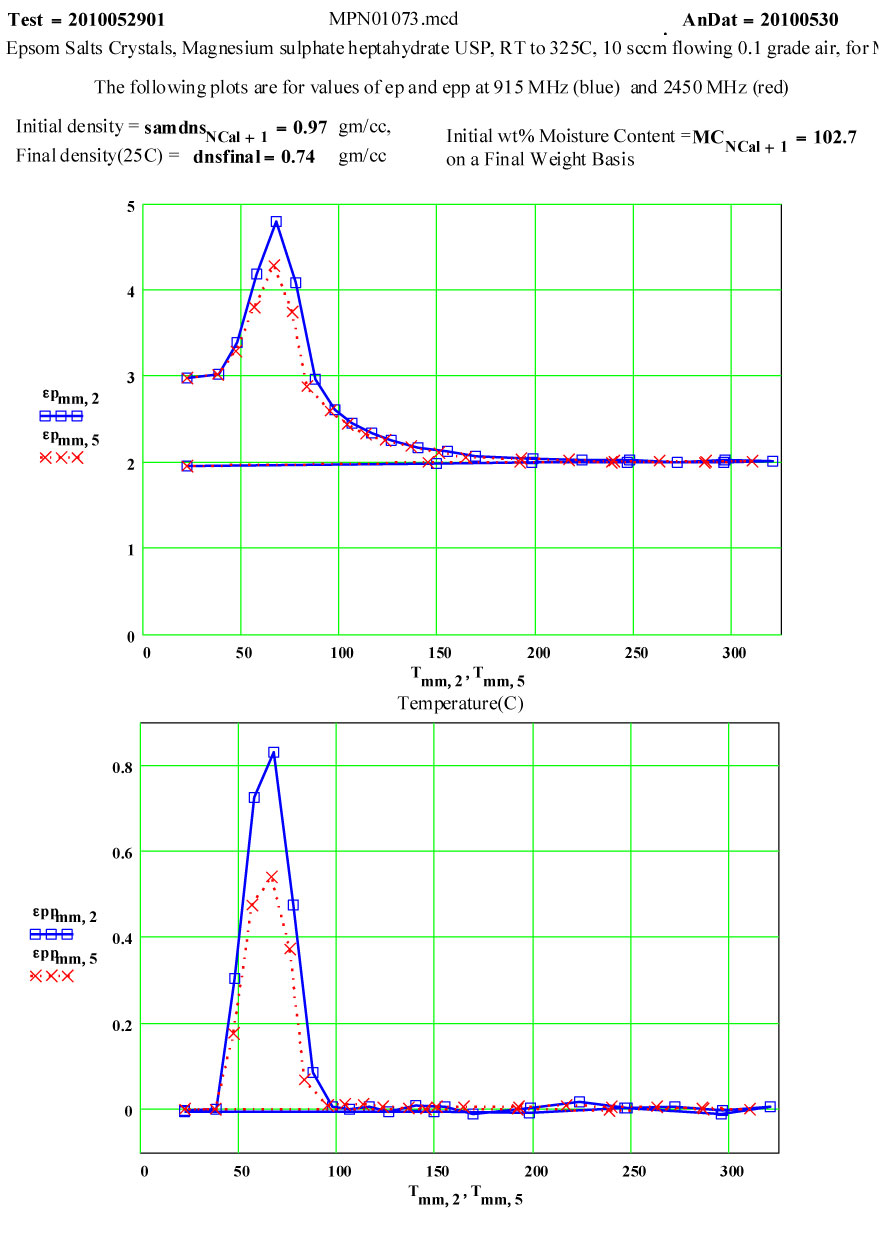
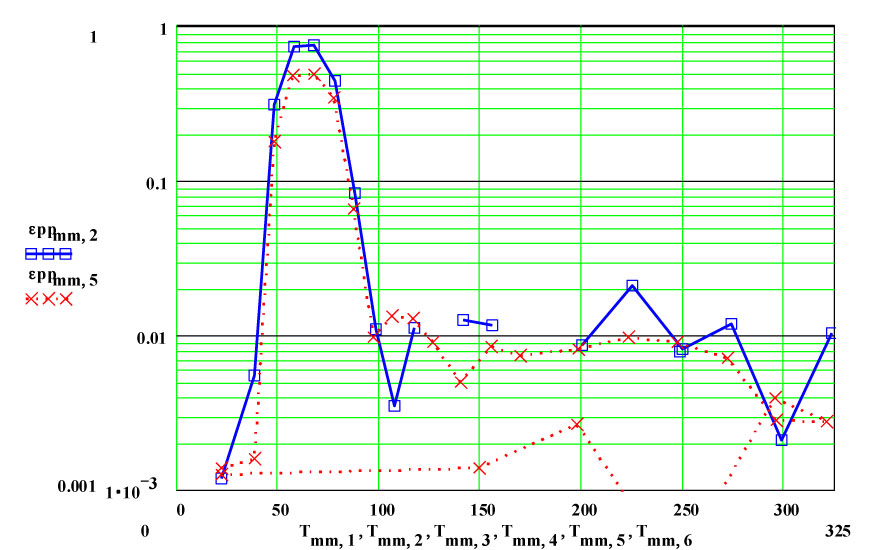
Note that random measurement errors affect the data when the numerical values go below epp ~ 0.01 , especially for the lower ( 915 MHz)frequency.
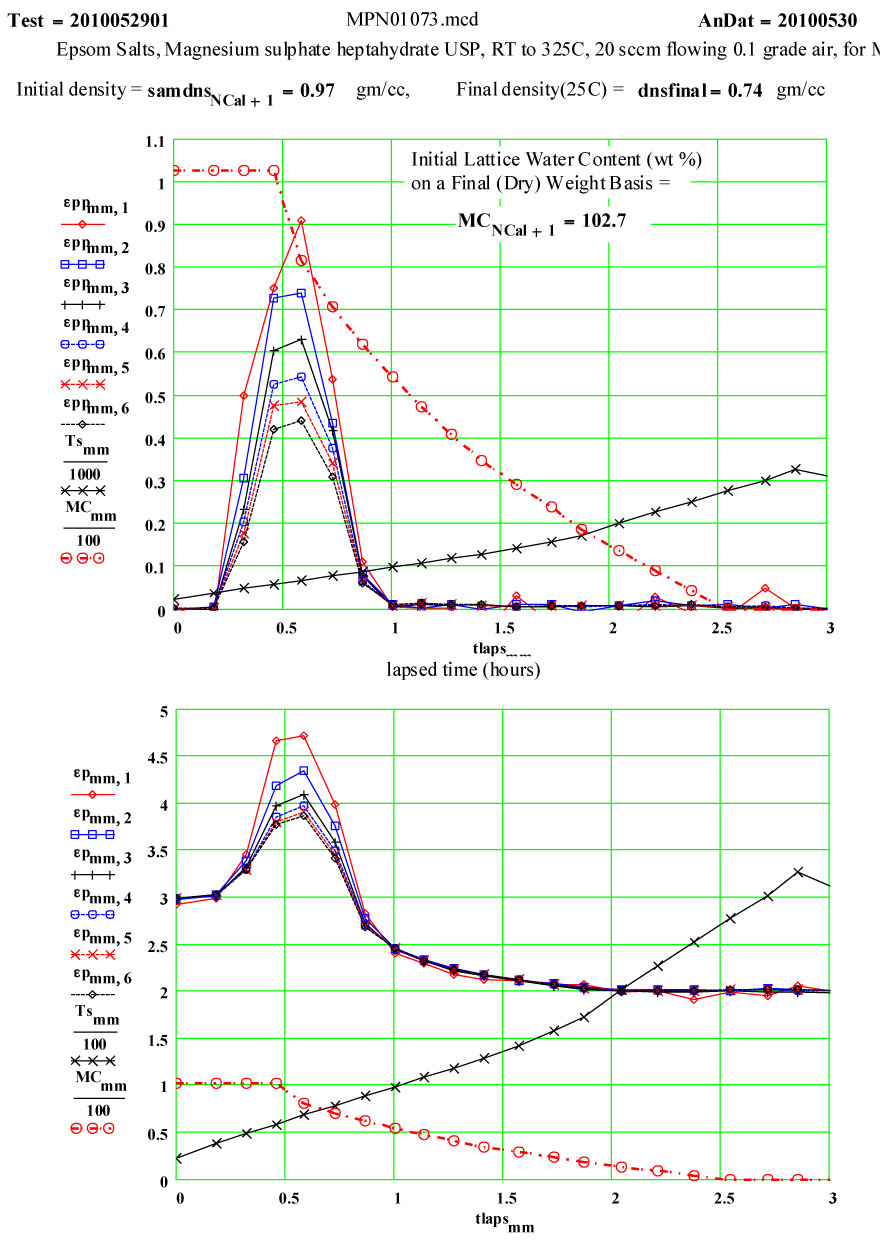
Second run, fresh sample, 1.4 hour hold at 69ºC, then ramping to 325ºC.
MADOC Marble
Marble: Calcium Carbonate with Impurities ( Ca CO3 → CaO + CO2)
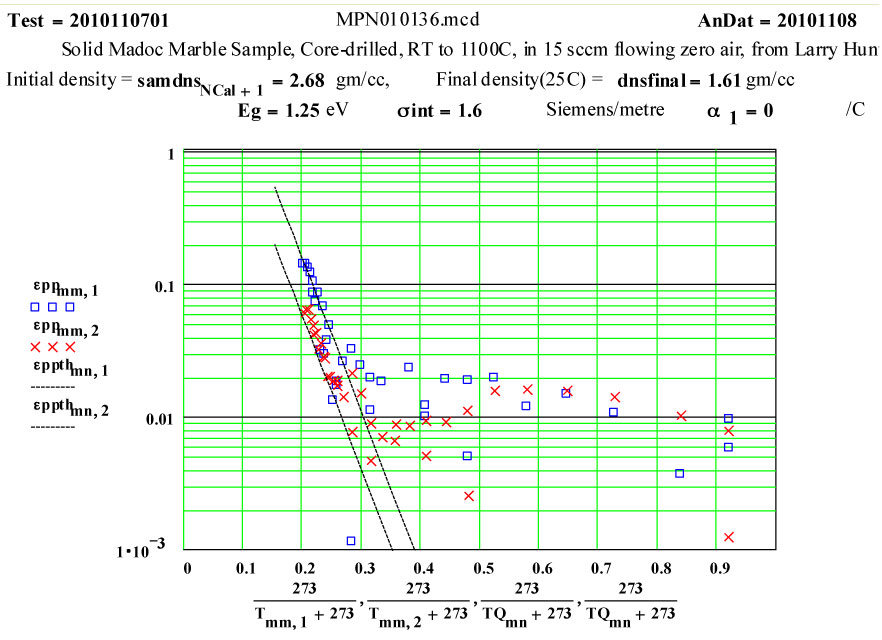
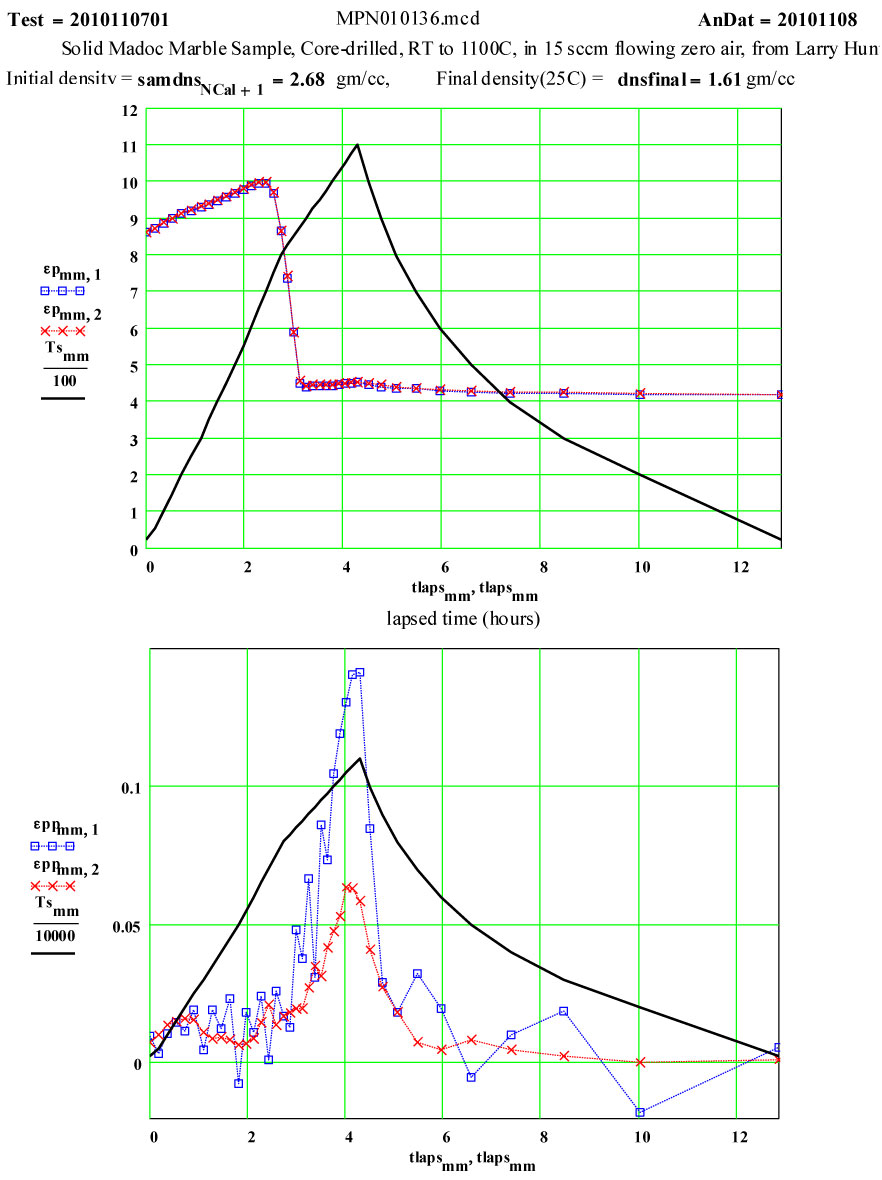
Intent of Measurement:Calcium Carbonate (limestone) releases carbon dioxide when heated ( a process called calcining) to form CaO – Calcium Oxide. This is a strongly endothermic reaction, with a standard heat of reaction of 44.3 kcal/mole. The temperature at which the dissociation occurs depends on the heating rate and the partial pressure of carbon dioxide over the sample. When heated at the partial pressure of carbon dioxide in STP air, calcium carbonate becomes unstable above 539ºC, but the progress of the dissociation process depends on temperature, time, pressure , particle size, etc. ( see Kingery, Bowen, Uhlman – Introduction to Ceramics). The predicted weight loss for complete dissociation is ~ 44%.
This experiment was designed to measure the complex dielectric constant during a cycle to 1100ºC and back down to room temperature. The values of ε″ are a measure of the relative absorption of microwaves during this process.
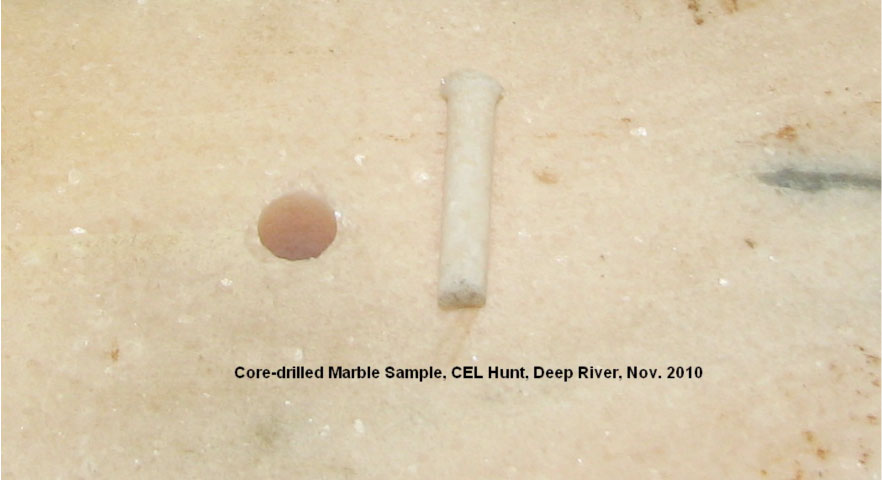
Sample Description: The sample was “Madoc Marble” ( slightly beige/pink – see picture), acquired by Dr. CEL (Larry) Hunt of Deep River, Ontario, Canada. The measurement sample was made by diamond core-drilling a large piece of solid marble. After cutting to length, the sample was baked for two hours at ~125C to drive off surface moisture.
- length (height) 12.05 ± 0.05 mm
- diameter 3.44 ± 0.05mm
- mass 0.300 ± 0.002 gm
- density 2.68 ± 0.08 g/cc
- appearance off white ( beige/pink) rod
Measurement Cycle Parameters:
The measurements were done in a single “run” cycle, with the furnace being stepped in 50ºC increments to each temperature up to 800ºC, then 25ºC increments to 1100ºC, and then -100C increments down to 200ºC, then room temperature. The sample mass was measured, and the empty holder was re-measured to establish background subtractions.
- length 11.77 ± 0.05 mm
- diameter 3.39 ± 0.05mm
- mass 0.171 ± 0.002 gm
- density 1.61 ± 0.05 g/cc
- appearance white rod
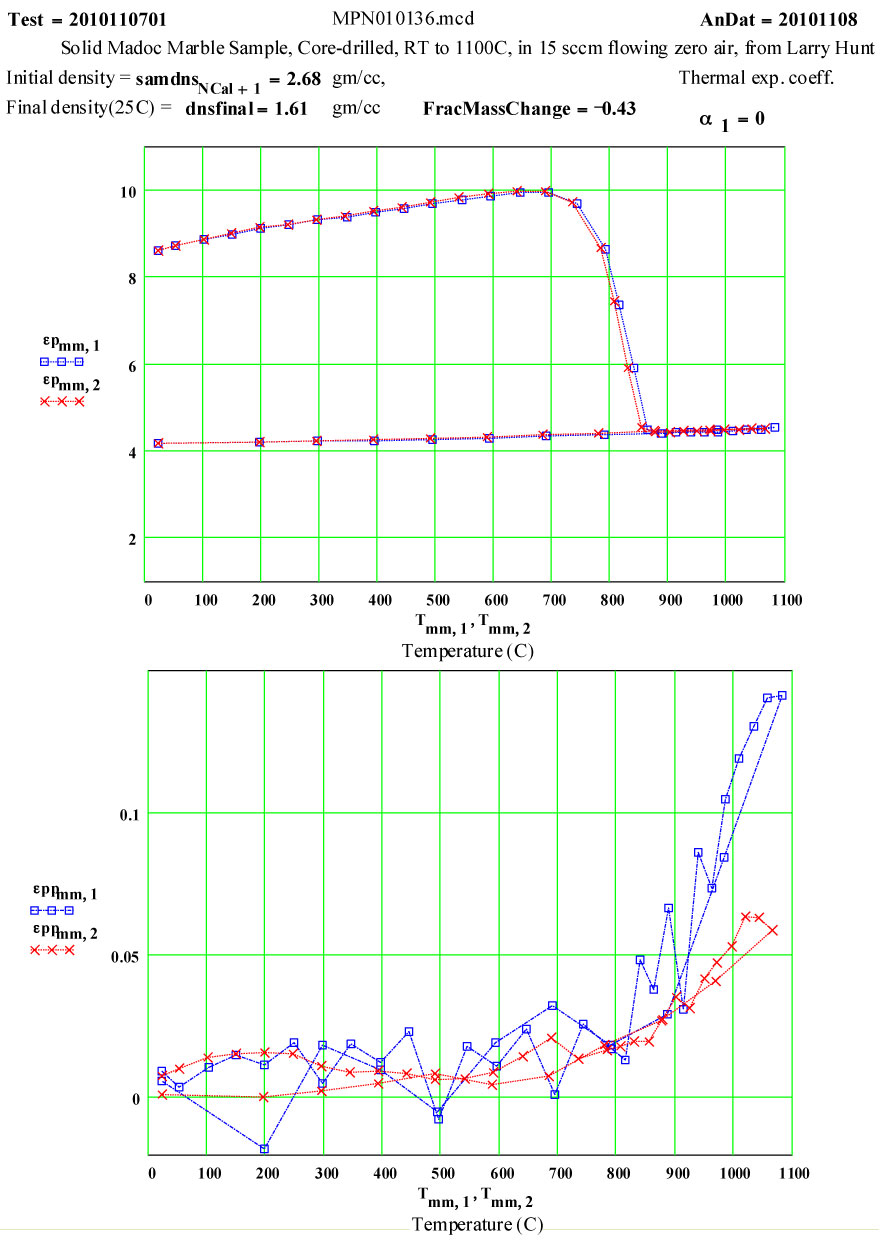
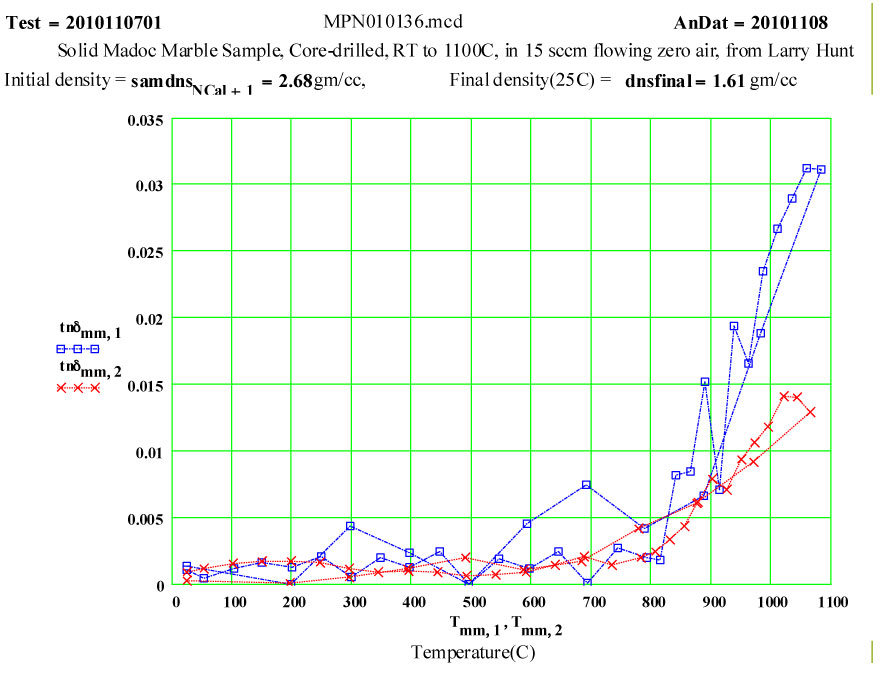
The small values of ε″ up to 800ºC may be attributable to small amounts of impurities in the marble.
The dissociation does not appear to start until 650ºC, and is complete by 850ºC. Between 850 and 1100ºC, the presumably highly defected calcia demonstrates a thermally activated ( likely intrinsic) microwave absorption with standard Arrhenius dependence. At low temperatures, the final calcia sample has very low microwave absorption.
The measured weight loss was ~ 43 ± 2 % ( initial weight basis), and the final density is 60% of the initial density.
Legend for Data Plots :
# Frequency(MHz) Symbol
1 912 blue square, solid line
2 2466 red cross, dotted line
Aragonite
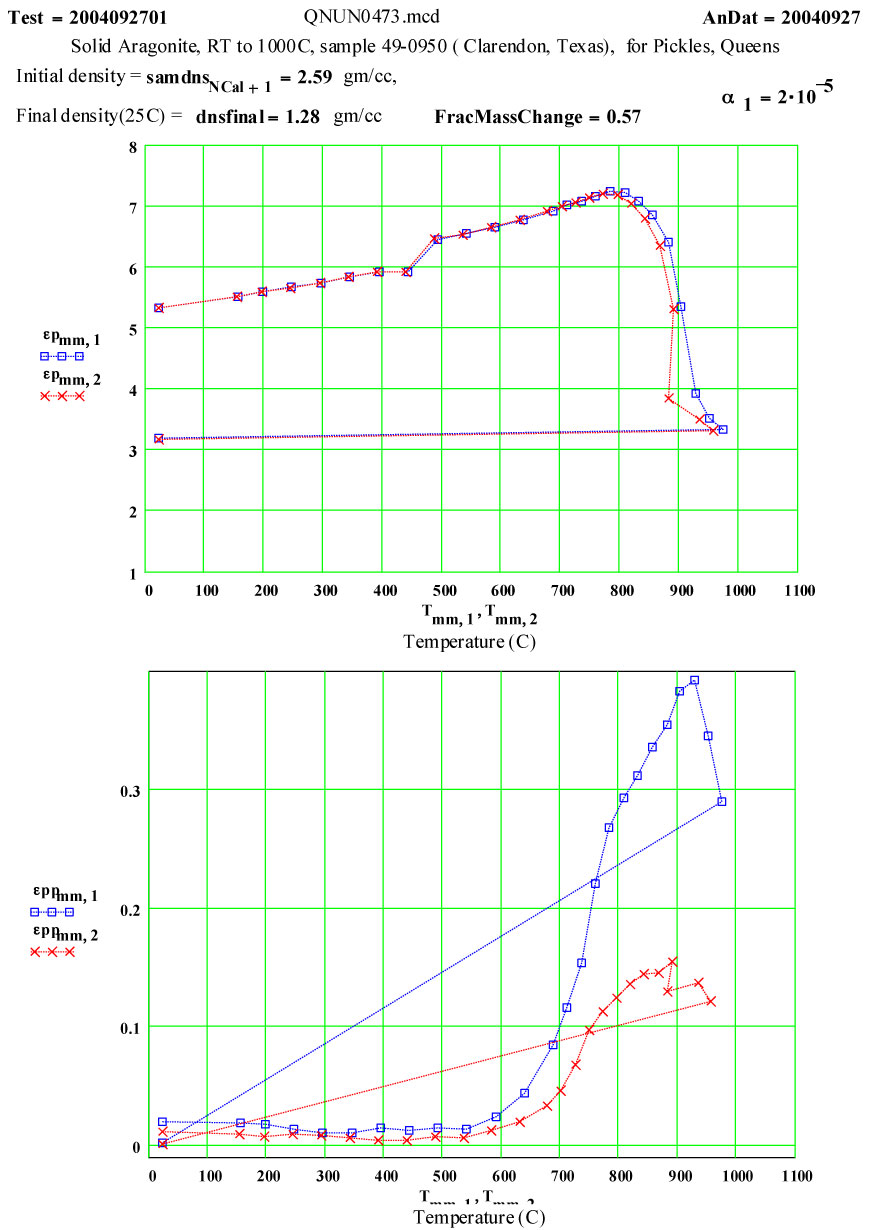
Aragonite: Orthorhombic Calcium Carbonate ( Ca CO3 → CaO + CO2)
Intent of Measurement:
Calcium Carbonate has various crystal forms, both of biogenic and of geologic origin. (Biogenic calcium carbonate is usually “aragonite” - orthorhombic calcium carbonate- structure.)
When heated at 1 atmosphere pressure, reference geological (mineral) aragonite ( molar volume = 34.150 cm3/mole ) transforms to rhombohedral calcite ( molar volume = 36.934 cm3/mole – an 8.1% volume increase) at a very sharp phase transition at 440ºC. When heated further, the calcite releases carbon dioxide ( process called calcining) to form CaO – Calcium Oxide. This is a strongly endothermic dissociation reaction, with a standard heat of reaction of 44.3 kcal/mole. The temperature at which the dissociation occurs depends on the partial pressure of carbon dioxide over the sample. When heated at the partial pressure of carbon dioxide in STP air, calcium carbonate becomes unstable and starts to dissociate above 539ºC, but the progress of the dissociation process depends on temperature, time, pressure , particle size, etc. ( see Kingery, Bowen, Uhlman – Introduction to Ceramics). The predicted weight loss for complete dissociation is ~ 44%.
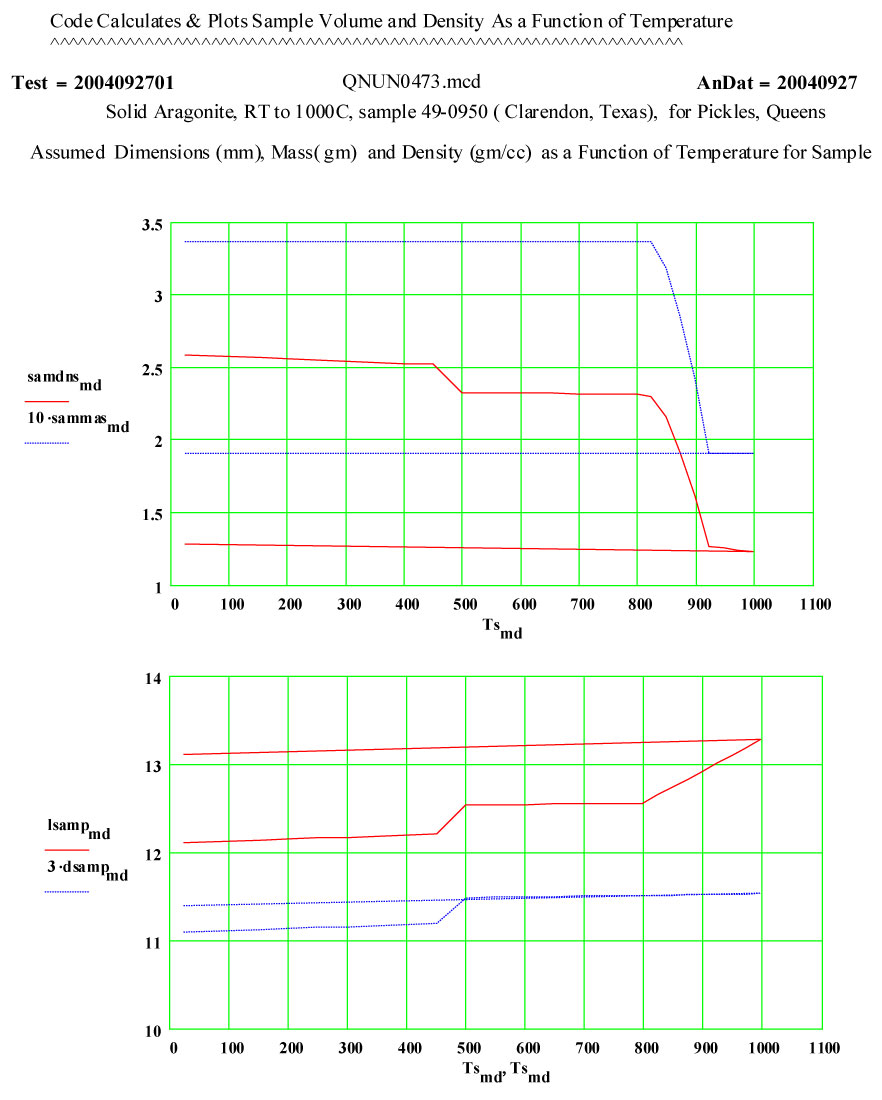
This experiment was designed to measure the complex dielectric constant of initially reference geologic aragonite during a cycle to 1100ºC and back down to room temperature. The values of ε″ are a measure of the relative absorption of microwaves during this process. Note that dielectric constants are normalized to unit volumes of material, and thus the change in volume at the phase transition must be taken into account in our data reduction. The linear thermal expansion coefficient of aragonite is ~ 20*10-6/C between room temperature and 300ºC.
This was a collaborative measurement with Prof. C. Pickles of Queens University, Kingston, Ontario, Canada.
Sample Description:
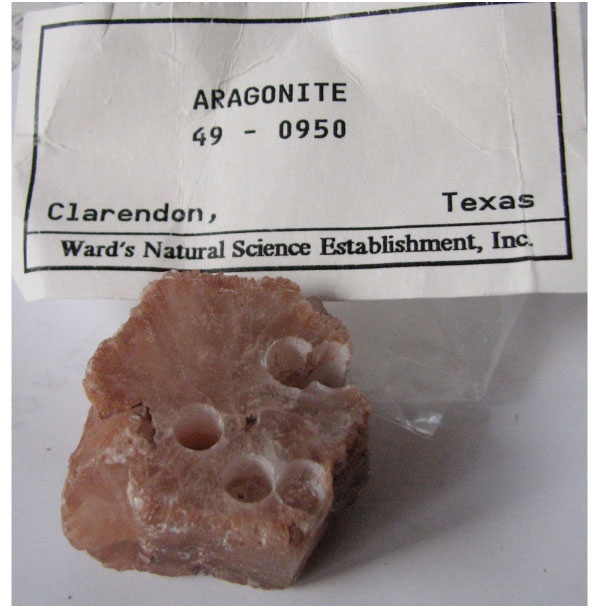
The original sample was solid piece of mineral aragonite ( Ward`s natural Science Establishment, Inc.- Sample 49-0950, Clarendon, Texas), acquired by Dr. C. Pickles. The measurement sample was made by diamond core-drilling, which produced 3 short cylindrical samples, which could be stacked.
Initial Sample Properties:
- length (height) 12.11 ± 0.05 mm
- diameter 3.70 ± 0.05mm
- mass 0.337 ± 0.002 gm
- density 2.59 ± 0.12 g/cc
- appearance 3 glassy rods with light orange-brown colour
Measurement Cycle Parameters:
The measurements were done in a single “run” cycle, with the furnace being stepped in 50ºC increments to each temperature up to 700ºC, then 25ºC increments to 1000ºC. The sample was allowed to cool and measured at room temperature. The final sample mass was measured, and the empty holder was re-measured to establish background subtractions.
Final Sample Properties:
- length 13.12 ± 0.10 mm
- diameter 3.80 ± 0.05mm
- mass 0.191 ± 0.002 gm
- density 1.28 ± 0.08 g/cc
- appearance white rod
Comments on the Data:
The expected phase transition to calcite is seen as a small change in ε′ just above 450ºC.
The values of ε′ suggest the formation of calcia does not start until ~ 800ºC, and is complete by 950ºC.
The small values of ε″ up to 550ºC suggest only small impurities in the material.
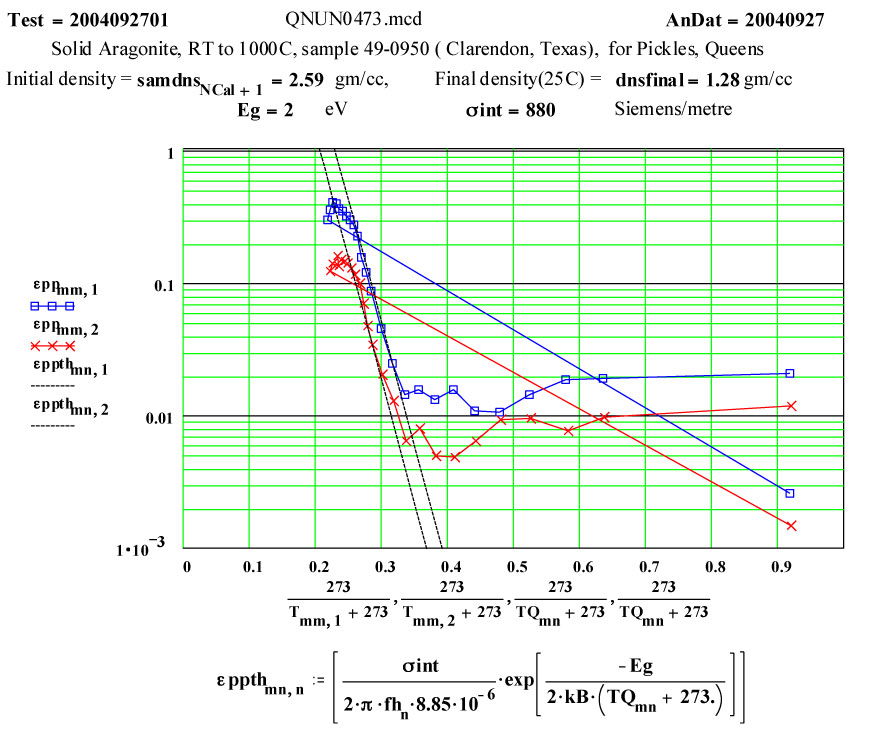
However, the temperature dependence of the loss factor, ε″, shows a rapid increase of a thermally activated loss mechanism ( see Arrhenius plot) starting at ~ 600ºC. By 800ºC, the rate of loss increase starts to decrease, presumably because the dissociation process starting. The final room temperature measurement ( presumably on the residual calcia) shows much lower microwave absorption than the initial material.
The measured weight loss was ~ 43 ± 2 % ( initial weight basis).
The frequency coding on the plots is :
Legend for Data Plots :
# Frequency(MHz) Symbol
1 912 blue square, solid line
2 2466 red cross, dotted line
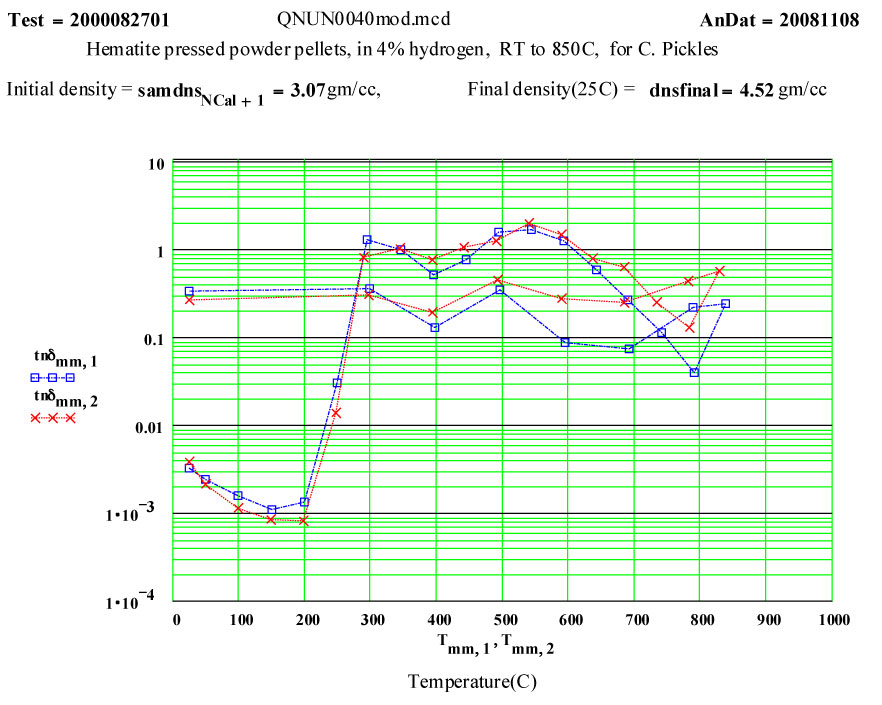
Hematite-4% Hydrogen
Hematite: Ferric Oxide ( Fe2O3 ) –
Intent of Measurement:
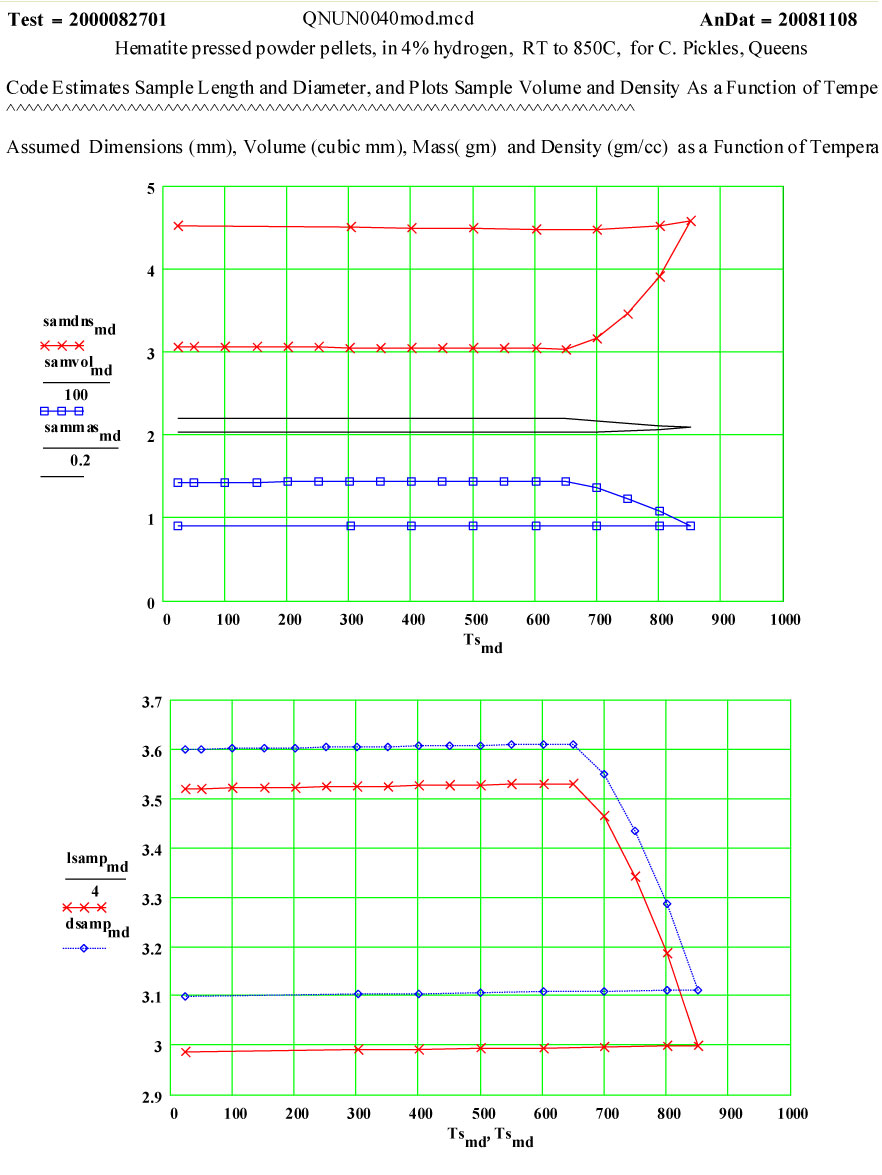
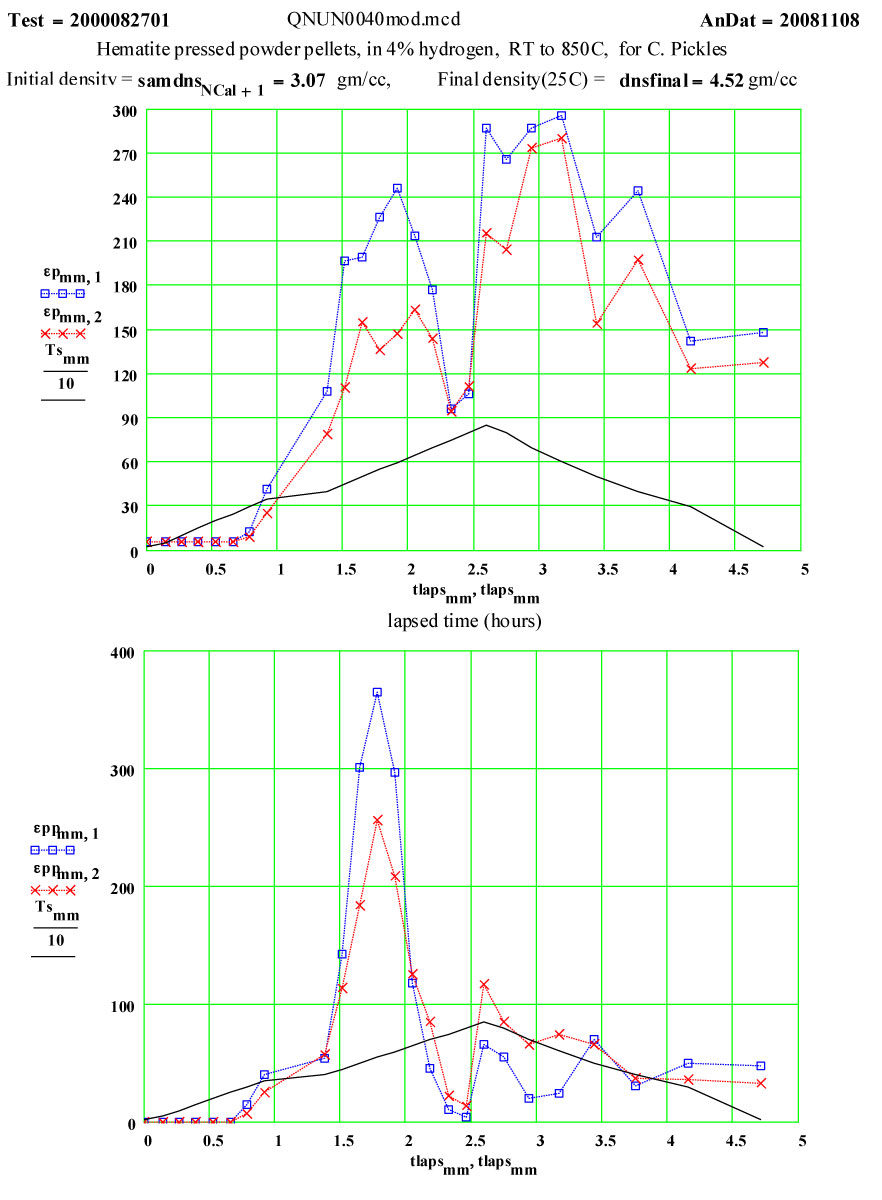
The measurement of dielectric properties during the course of a reaction is easily accomplished with the MPN cavity perturbation measurement system. The reduction of ferric oxide in hydrogen seemed an interesting and possibly useful example of the technique. This experiment was designed to measure the complex dielectric constant of a reacting sample during a cycle to 850ºC in a flowing 4% hydrogen/argon cover gas. The final product of the run cycle was expected to be magnetite. This was a collaborative measurement with Prof. C. Pickles of Queens University, Kingston, Ontario, Canada.
Sample Description:
The sample was made by uniaxially pressing a standard red hematite powder, supplied by Prof. Pickles, into 4 small pellets, which were stacked to form the measurement sample. The theoretical density of hematite crystals is quoted as 5.24 g/cc.
Initial Sample Properties:
- length (height of stack ) 14.08 ± 0.05 mm
- diameter 3.60 ± 0.05mm
- mass 0.440 ± 0.002 gm
- bulk density of pellets 3.07 g/cc
- appearance 4 red-brown pellets
Measurement Cycle Parameters:
The measurements were done in a single “run” cycle, with the furnace being stepped in 50ºC increments to each temperature up to 850ºC and then returned to 300ºC in -100C steps, with a final measurement at room temperature. The gas ( 4% hydrogen/argon) flow was maintained at 10 sccm up past the sample during the run. A small ceramic-fibre plug was used to partially seal the top of the sample holder to prevent backflow of air.
Final Sample Properties:
- length 11.98 ± 0.05 mm
- diameter 3.10 ± 0.05mm
- mass 0.408 ± 0.002 gm
- bulk density of pellets 4.52 g/cc
- appearance 4 dark grey pellets
The final pellets appeared to be somewhat ferrimagnetic, as they stuck to a steel screwdriver.
The ratio of the final mass divided by the initial mass is 0.927, very close to the theoretical ratio of 0.937 expected for transformation from pure hematite to pure magnetite with oxygen released, presumably forming steam which is carried away by the gas flow.
The final room temperature density value suggests a modest amount of sintering of the defected magnetite that was formed during heating.
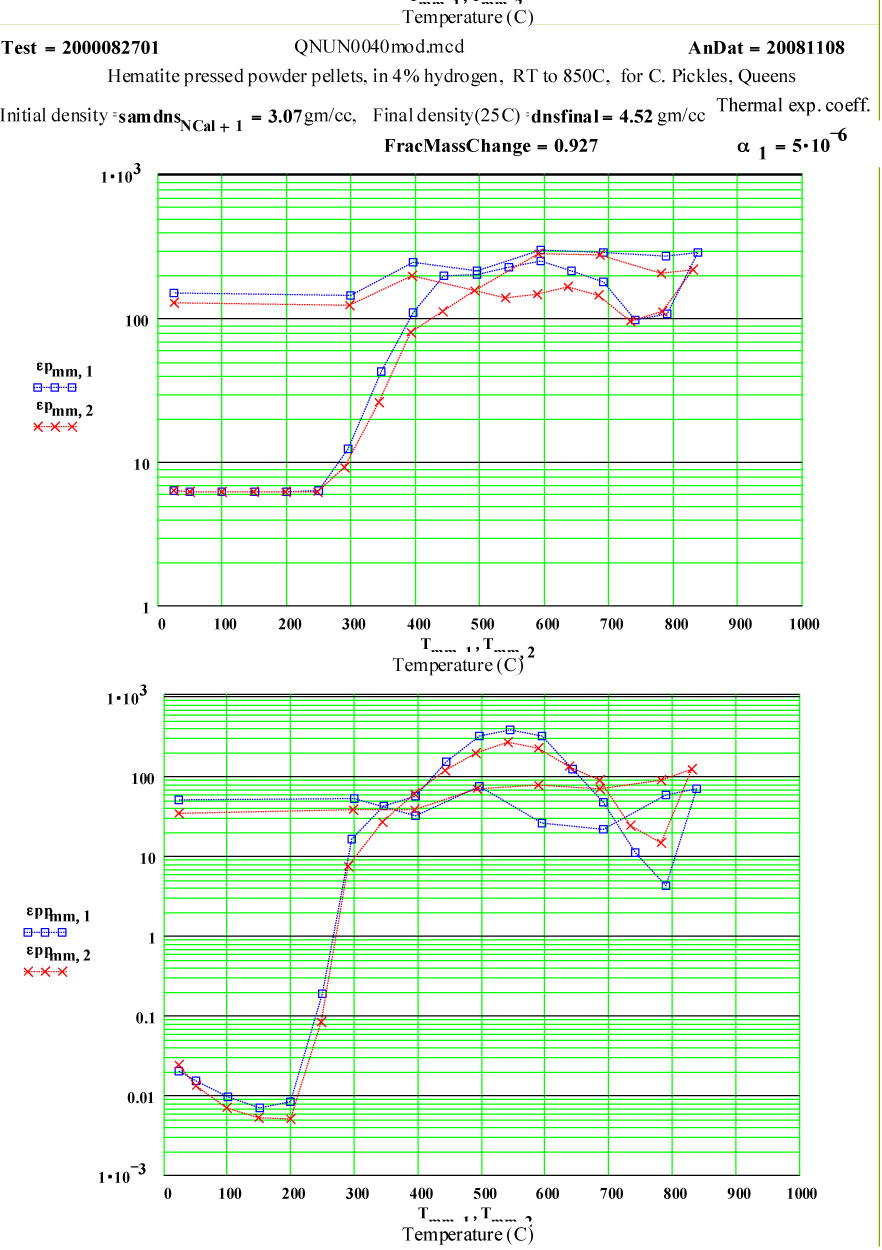
Comments on the Data:
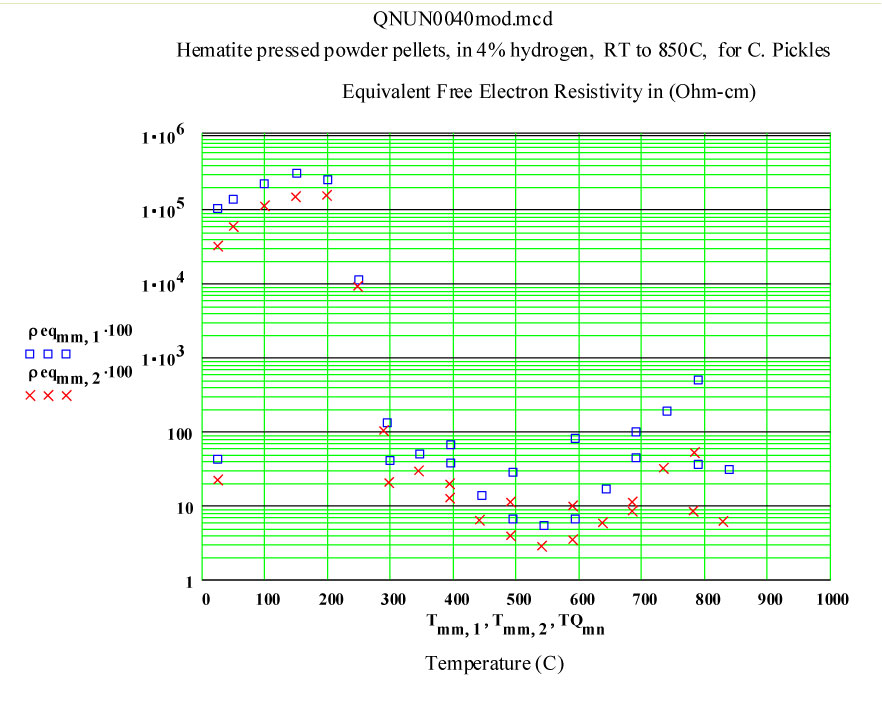
Clearly a radical transformation is the material properties takes place between 200ºC and 400ºC. It appears that the high frequency electrical conductivity of the sample is dramatically increasing.
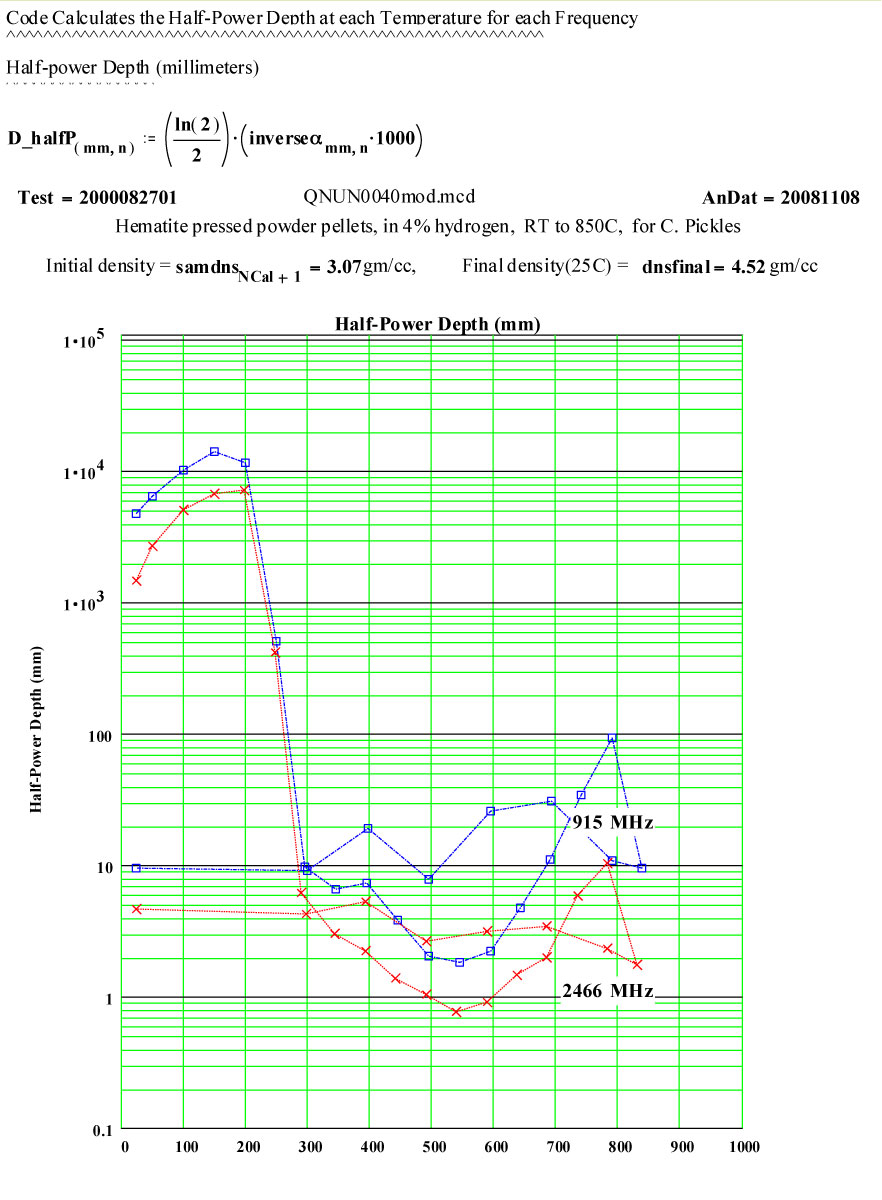
At and above 400ºC, the apparent conductivity is very high, so high that our data analysis assumptions are somewhat beyond their range of validity! Our analysis equations are based on assuming uniform electric field inside the sample, and when this is not the case, our values are increasingly in error! Between 400ºC and 700ºC on the way up in temperature, the calculated values of the “Half Power Depth” are less than 3 mm, meaning the electric field at the centre of the sample must be appreciably lower than just inside the surface, and suggesting our determined values for ε' and ε'' should not be trusted!
It appears that the conductivity decreases slightly at the highest temperatures – which suggests that the defected magnetite that forms is more conductive than the final, somewhat sintered, material.
Much work, in particular high temperature XRD, would need to be done to understand the sequence and degree of transformations.
The frequency coding on the plots is :
Legend for Data Plots : # Frequency(MHz) Symbol
1 912 blue square, solid line
2 2466 red cross, dotted line
Please feel free to phone or e-mail and discuss possible measurements. We treat all communications as confidential unless advised otherwise.
